
Figures & data
Table 1. Patient demographics and clinical characteristics.
Figure 1. Focus groups: frequency of the most common words or phrases considered to be important to patients in describing exacerbations to othersa (n = 41). aDuplicate responses were included.
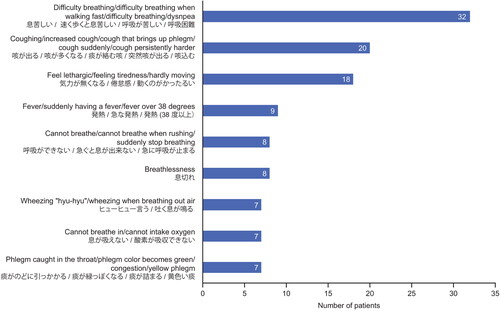
Figure 2. Part 3 questionnaire responses: demonstrating distribution of (A) Items 1–20 and (B) Items 21–26. Items 22 to 26 were questions about phlegm that were only completed by patients who selected “rarely”, “occasionally”, or “frequently” to item 21.
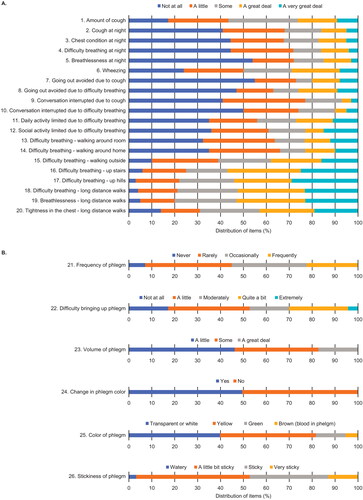
Figure 3. Scree plot from factor analysis.
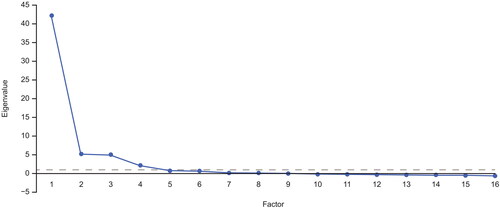
Table 2. Factor loadings after rotation.
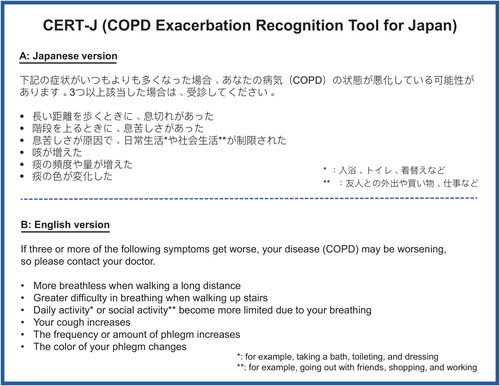
Figure 4. Final CERT-J.
CERT-J, COPD Exacerbation Recognition Tool in Japan; COPD, chronic obstructive pulmonary disease.
Supplemental Material
Download PDF (386 KB)Data availability
Due to the nature of this research, participants of this study did not agree for their data to be shared publicly, so supporting data is not available.