
Figures & data
Figure 1. Inflammatory response of lung tissues in COPD rat model. (a) Lung function assay shows the expiratory resistance (Re), inspiratory resistance (Ri) and airway compliance (Cldyn) in LPSL model. (b, c) Flowcytometric assay show the populations of Th17 (CD4+/IL-17A+) (b) and Treg (CD4+/FOXP3+/CD25+) (c) CD4 cells in peripheral blood. (d) H&E staining show the inflammatory cells invasion in lung tissues of COPD compared to NC with 400× magnification. Lymphocytes presenting the small cytoplasm, large nucleus and blue staining are highlighted by red arrows. (e, f) IHC shows the positive staining of IL-10 (e) and IL-17A (f) in different samples with 400× magnification. (g) ELISA shows the expression of IL-10 and IL-17A in serum of COPD model. “*” and “Δ” mean the statistical significance with p less than 0.05 compared to NC and LPS group respectively. Abbr eviation: NC, negative control; LPS, LPS-induced COPD model; LPSL, LPS treated with 0.5% sevoflurane; LPSH, LPS treated with 2% sevoflurane.
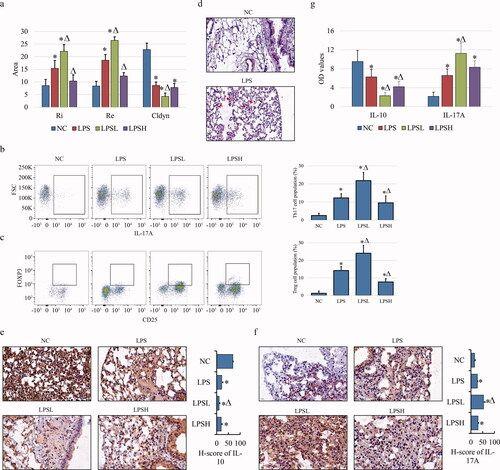
Figure 2. DNA methylation in ATII cells of COPD. (a) ATII cells were sorted based on positive autofluorescence (FITC) and negative expression of CD45 and CD31 (upper panels). cells were re-analyzed the expression of CD45, CD31 and intracellular CD74 before (bottom left panel) and after (bottom right panel) sorting. (b) Dot plot assay (upper panel) and line chart (bottom panel) show the overall genomic DNA methylation of different samples. “Δ” and “ΔΔ” mean the statistical significance with p less than 0.05 and 0.01 compared to LPS group. (c-d) Bar charts show the mRNA relative levels by qPCR (c) and DNA methylation levels on promoter by MeDIP-qPCR (d) of genes including Sftpa1, Napsa, Ca2, Sfta2, Lamp3, Wif1, Pgc, and Etv5. (e) Scatter diagram shows the Pearson correlation analysis between mRNA and DNA methylation levels.
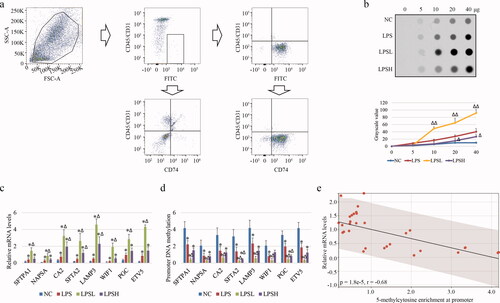
Figure 3. DNMT1 binding ability on gene promoter affected by sevoflurane. (a) The expression of DNMTs and REC8 by WB assay in different samples. (b-e) Bar charts show the occupancies of DNMT1 (b), DNMT3A (c) and DNMT3b (d) on gene promoter in different samples by ChIP-qPCR. IgG (e) used as a negative control.
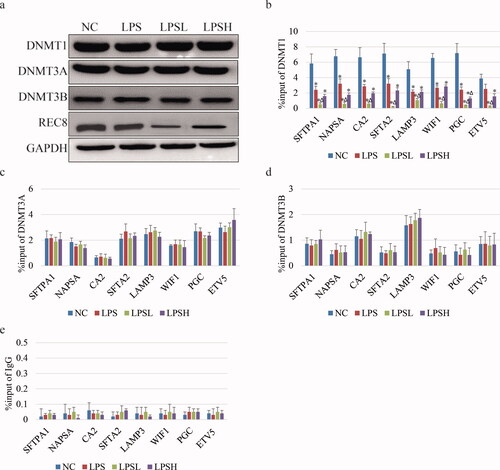
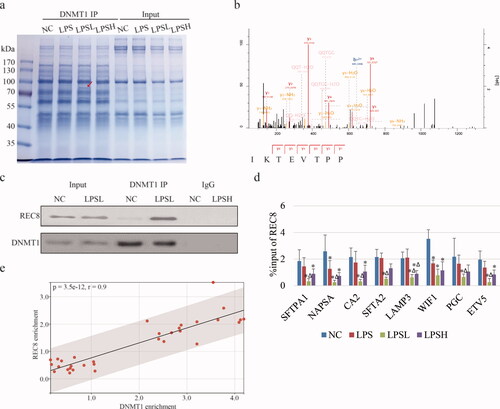
Figure 4. Interaction between REC8 and DNMT1. (a) Coomassie bright blue stain shows the binding proteome of DNMT1. Red arrow highlights the specific band only exists in LPSL. (b) Secondary mass spectrum shows the partial peptide “TEVTPP” of the interested band, which is identified as REC8. (c) IP-WB assay shows the interaction between REC8 and DNMT1. (d) Bar charts show the occupancies of REC8 on gene promoter in different samples by ChIP-qPCR. IgG is referred as . (e) Scatter diagram shows the Pearson correlation analysis between enrichment of REC8 and DNMT1 on target genes.
Data availability statement
All data generated or analyzed during this study are included in this published article.