
Figures & data
Table 1. Primer sequences for RT-qPCR.
Figure 1. Successful construction of COPD mouse model. Hematoxylin-eosin staining and Masson staining of lung tissues in Control and COPD. (A) Hematoxylin-eosin staining of lung tissues in each group (200×, 100 μm). (B) Masson staining of lung tissues in each group (200×, 100 μm). (C–D) Detection of ki67 and Caspase-3 by immunohistochemistry (200×, 100 μm).
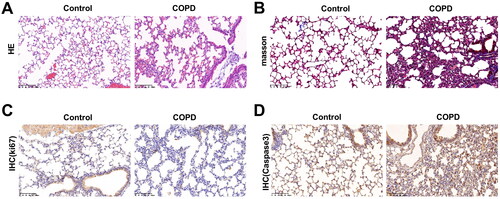
Figure 2. Detection of inflammatory factors in serum and RTEL1 expression in lung tissues of COPD mice. (A) ELISA was applied to detect TNF-α, IL-1β and MMP-9 in mice. (B) RT-qPCR was used to detect the mRNA level of RTEL1. (C) Western blotting was performed to detect the protein expression of RTEL1. **p < .01 vs. control.
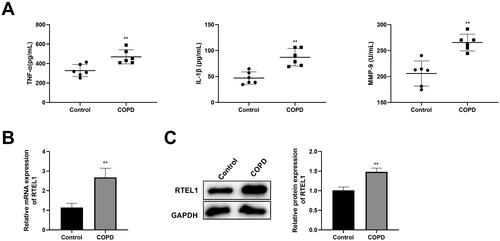
Figure 3. Detection of the expression levels of M1 and M2 macrophage markers, iNOS and CD206 in Control and COPD group by RT-qPCR (A) and western blotting (B). **p < .01 vs. control.
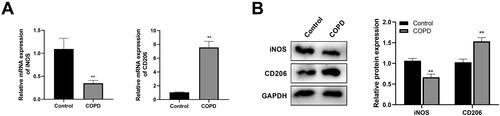
Figure 4. Down-regulation of RTEL1 can improve the development of COPD. (A) RT-qPCR was used to detect the knockdown efficiency of RTEL1. (B) Hematoxylin-eosin staining of lung tissues in each group (200×, 100 μm). (C) Masson staining of lung tissues in each group (200×, 100 μm). (D–F) Detection of RTEL1, ki67 and Caspase-3 by immunohistochemistry (200×, 100 μm) and IHC scores. F. ELISA detection of inflammatory factors (TNF-α, IL-1β, MMP9, IL-4, IL-6, and IL-33) in mice. **p < .01 vs. control ##p < .01 vs. lv-sh-NC.
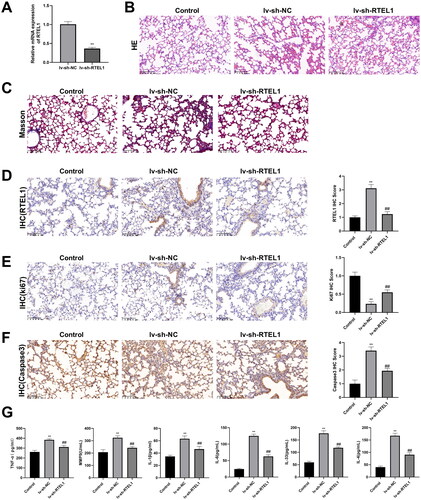
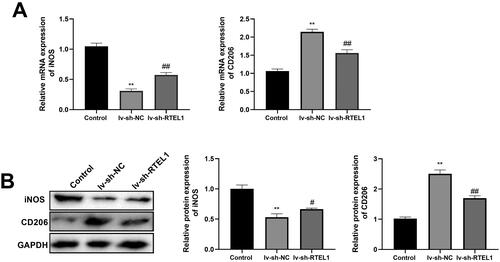
Figure 5. Down-regulation of RTEL1 can promote M1 and inhibit M2 macrophage polarization in COPD mice. (A) RT-qPCR was used to detect the expression levels of macrophage markers iNOS and CD206 in mice. (B) Western blotting was performed to detect the protein expression of macrophage markers iNOS and CD206 in mice. **p < .01 vs. control #p < .05 vs. lv-sh-NC ##p < .01 vs. lv-sh-NC.
Data availability statement
The datasets used and/or analyzed during the current study are available from the corresponding author on reasonable request.