Figures & data
Figure 1 (a) Schematic diagram of the cylindrical steel trap assembly, epi-microscope, sample loading, and ultrasound generation. Its main components were a 1.5 MHz disc transducer attached to a steel acoustic coupling layer, a sample volume, and a glass acoustic reflector. (b) Back view of the trap assembly. (Reproduced from Bazou et al. Citation2006, with permission of Taylor and Francis). (c) PZ-HPV-7 cell aggregate levitated in the trap for 5 min; pressure, 0.27 MPa. Cell aggregate morphology was closely packed, with little evidence of the hexagonal order that is typical of non-interacting spheres. Scale bar is 100 μ m.
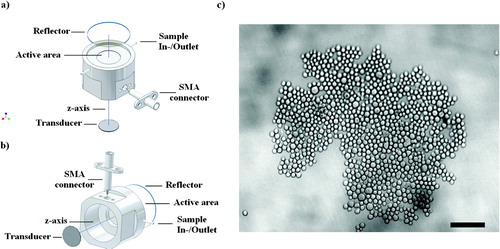
Figure 2 i) Schematic diagram of an interacting cell doublet; L is the length of the F-actin staining region or ‘chord’ (drawn here as a straight line), R is the radius of the cells, and θ is the angle subtended by the chord at the center of the cell. ii) The angle θ of the ‘cell–cell interface chord’ for 20 randomly selected pairs of cells from a slide of each of quadruplicate experiments after 1 and 60 min of levitation in the trap, for both cell lines (error bars represent one standard error of the mean). iii) Integral intensity measurements of F-actin at the cell–cell interface of 20 randomly selected pairs of cells from a slide of each of quadruplicate experiments after 1 and 60 min of levitation in the trap, for both cell lines (error bars represent one standard error of the mean).
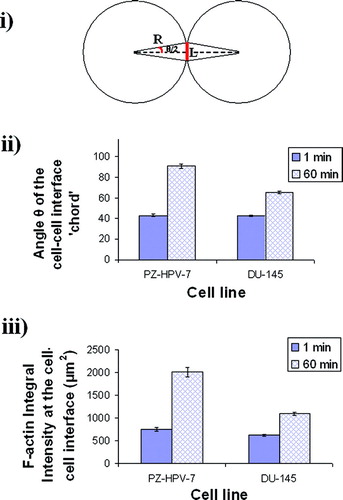
Table 1 Exemplar 2 × 2 contingency table constructed for the identification and scoring of the distribution of E-cadherin (as well as α-, β-, and γ-catenins) in both cell lines
Figure 3 i) Representative micrographs and ii) their pseudo color images of the distribution of E-cadherin (a, pericellular staining; f, diffuse staining), F-actin (b, nuclear staining (arrows); g, cortical F-actin (arrows)), α-(c, perinuclear halo (arrows); h, diffuse staining), β-(d, discrete intracellular staining (arrows); i, diffuse staining) and γ-(e, discrete intracellular staining (arrows); j, diffuse staining) catenins in PZ-HPV-7 (a–e) and DU-145 (f–j) non-sonicated (control) cells after 1 h in suspension culture. Scale bar is 20 μ m.
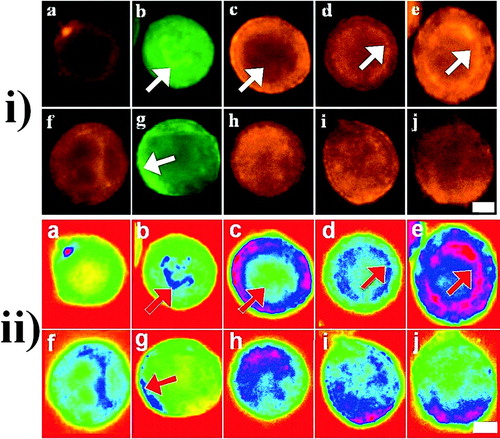
Figure 4 Distribution of E-cadherin and F-actin in PZ-HPV-7 (a and b, respectively) and DU-145 (c, d) cells exposed to ultrasound for 1 min. PZ-HPV-7 cells showed a ring-type distribution of E-cadherin (a) and internal regions of high phalloidin stain (b, arrows). In contrast, DU-145 cells displayed a granulated ring-type E-cadherin distribution (c), while no high phalloidin internal regions were observed (d). Zoom-in images highlight the distribution pattern. Scale bar is 50 μ m.
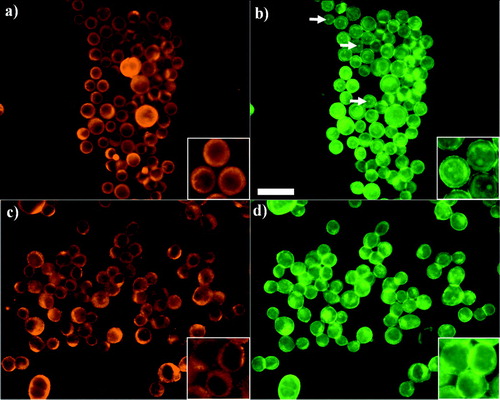
Figure 5 Distribution of E-cadherin and F-actin in aggregated PZ-HPV-7 (a and b, respectively) and DU-145 (c, d) cells levitated for 1 h. E-cadherin in PZ-HPV-7 cells has accumulated at the cell–cell interface in a granular pattern (a), possibly associated with the formation of adherens junctions, whereas the internal regions of high phalloidin stain, shown in the 1 min samples () are still present (b). DU-145 cells retained the ring-type pattern at the periphery of the cells, while a more intense staining was often not confined to a cell-cell contact region (c), while F-actin had clearly concentrated at the cell–cell interface (d) with no evidence of internal high phalloidin stain regions. Zoom-in images highlight the distribution pattern. Scale bar is 50 μ m.
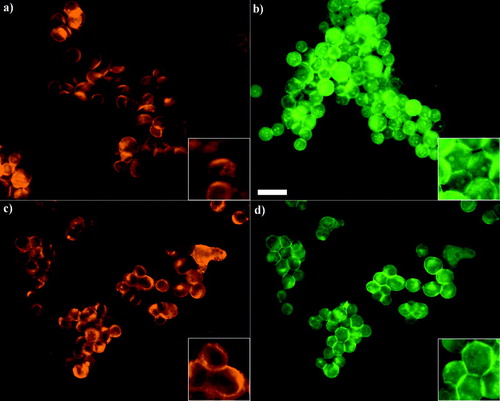
Figure 6 i) Distribution of α-catenin in PZ-HPV-7 (a, b) and DU-145 (c, d) cells aggregated for 1 (a, c) and 60 min (b, d). α-catenin in both cell types showed progressive accumulation at the contact interface. The arrows (c, d) show the cytoplasmic/nuclear α-catenin-free region in both cell types. Scale bar is 50 μ m. ii) Integral intensity measurements of α-catenin at the cell–cell interface of 20 randomly selected pairs of cells from a slide of each of quadruplicate experiments after 1 and 60 min of levitation in the trap, for both cell lines (error bars represent one standard error of the mean).
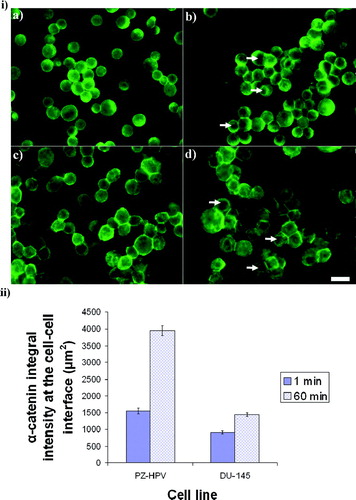
Figure 7 i) Distribution of β-catenin in PZ-HPV-7 (a, b) and DU-145 (c, d) cells levitated for 1 min (a, c) and 1 h (b, d). β-catenin in PZ-HPV-7 cells was distributed around the rim of the cells (a), with progressive accumulation at the contact interface (b). The arrows in (a) show the cytoplasmic/nuclear β-catenin-free region. In contrast, in DU-145 cells a diffuse cytoplasmic staining of β-catenin was observed (c, d), also with some accumulation at the cell–cell interface over time (d). ii) Distribution of γ-catenin in PZ-HPV-7 (a, b) and DU-145 (c, d) cells exposed to ultrasound for 1 (a, c) and 60 min (b, d). No difference could be detected between the distribution patterns of γ-and β-catenins for both cell lines examined. Arrows in (a) show the cytoplasmic/nuclear γ-catenin-free region. iii) Integral intensity measurements of β-and γ-catenins at the cell–cell interface of 20 randomly selected pairs of cells from a slide of each of quadruplicate experiments after 1 and 60 min of levitation in the trap, for both cell lines (error bars represent one standard error of the mean). Scale bars are 50 μ m.
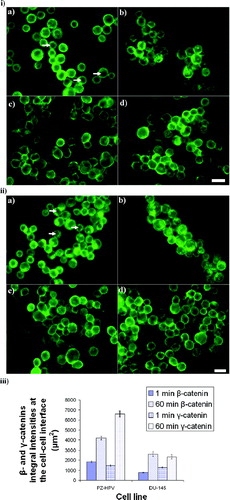
Table 2 Differences in the angle θ (± standard error of the mean) made by the cell–cell interface ‘chord’, F-actin integral intensity (μ m2) of Phalloidin-Alexa Fluor 488 (± standard error of the mean) and void index (Bazou et al. Citation2004) of various cell systems (Bazou et al. Citation2005a, Citation2006) analysed after 1h* of cell–cell contact initiation in the ultrasound trap