Figures & data
Figure 1 A: Schematic of the ultrasound trap (reproduced from Coakley et al., Citation2004, with permission). B: The ultrasound trap (U) on microscope stage and syringe used for loading and emptying the trap (S).
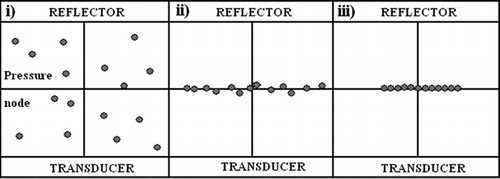
Figure 2 Schematic showing the formation of an aggregate of cells in the ultrasound trap (reproduced from Coakley et al., Citation2004, with permission). i: cells in suspension in trap with no ultrasound; ii: upon initiation of ultrasound exposure, cells congregate at the pressure node; and iii: the formation within a short time of a 2-D monolayer aggregate of cells.
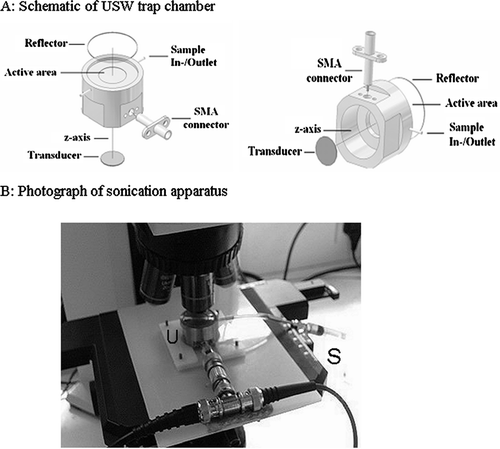
Figure 3 Development of HepG2 cell aggregate in the USWT at (A) 30 s, (B) 3 min, and (C) 15 min. Mean aggregate area increases with aggregate age until 3 min (D). Bar in micrographs represents 200 μ m.
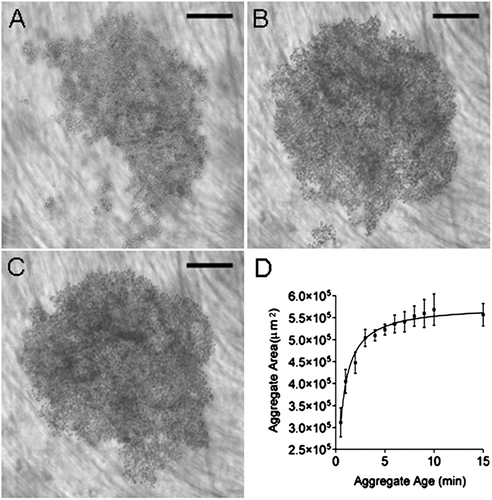
Figure 4 Representative images of (A) the circular morphology of HepG2 cells at 30 s following introduction into the USWT and (B) the departure from circular morphology following 10 min sonication in the trap. Cells show overlapping (o) and membrane spreading at points of contact (s) leading to an increase in the interfacial length (i) and an overall reduction of voids (v) within the aggregate. Aggregate age dependence of (C) Cell circularity; (D) Membrane spreading (as assessed by length of contact interface); and (E) void index. (F) Changes in circularity and void index correlate with membrane spreading (interfacial length). Bar in micrographs represents 10 μ m.
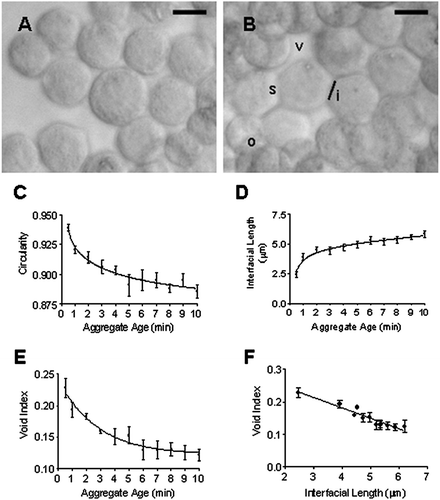
Figure 5 Fluorescence micrographs and 3-D surface intensity plots (inset shows magnified region of micrograph used for construction of surface plot) of F-actin stained with Phalloidin-Alexa488 in aggregates aged 2 min (A, B), 4 min (C, D), and 11 min (E, F), demonstrating that an increase in F-actin at regions of contact between HepG2 cells can be detected in aggregates aged 4 min. Bar in micrographs represents 20 μ m, and bar in magnified insets represents 2 μ m.
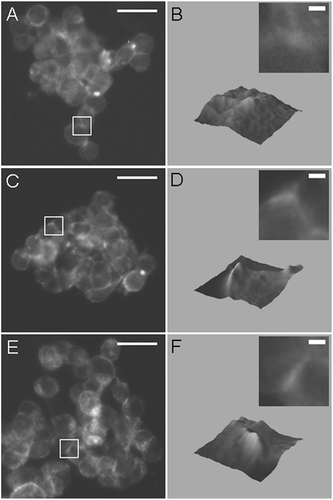
Figure 6 (A) Graphical representation of mean F-actin intensity plot profiles demonstrating a significant buildup of F-actin at the cell–cell boundary in aggregates aged greater than 3 min. A time zero control F-actin distribution across the periphery of a single cell was shown in mirror image (dotted line). (B) Area under curve and peak intensity of F-actin from A increase with aggregate age.
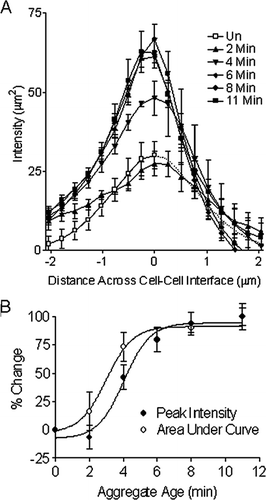
Table 1 Changes in indices of cell shape and F-actin with increasing aggregate age