Figures & data
Figure 1. The effects of LiCl on Cx43 expression in myoblasts. (A) RT-PCR analysis of Cx43 mRNA expression in different treatment groups. (C) Western blot analysis of Cx43 expression in skeletal myoblasts with various concentration of LiCl treatment. (E) Treatment with 10 mM LiCl from 24 to 72 h. Cx43 was detected as three bands corresponding to the phosphorylation states and unphosphorylation states of this connexin. (B, D, F) Quantitative analyses of Cx43 mRNA and protein expression are shown in the graphs as relative percentage (means±SEM) from n =3–4 independent experiments. *p < 0.05 and **p < 0.01 versus untreated cells.
Figure 2. (A) Fluorescent images of Cx43 expression in skeletal myoblasts. Cx43 is expressed less in control cells with DM, and after LiCl stimulation, its expression increases. (B) A quantitative analysis of the immunostaining intensity for Cx43 expression is shown in the graph as relative percentage (mean±SEM) from three independent experiments. *p < 0.05 versus control.
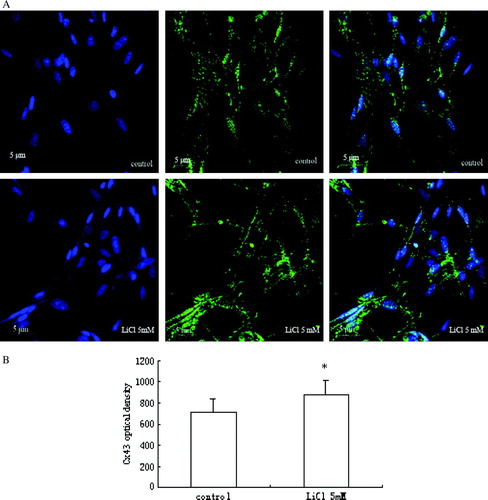
Figure 3. Gap-junctional communication between myoblasts. (A) Representative flow-cytometric analyses after recipient myoblasts labeled with PKH26 and donor myoblasts stained with calcein AM were cocultured for 24 h in culture medium containing 5, 10, and 20 mM LiCl and 20 mM NaCl, respectively. PKH26-calcein–positive myoblasts are in right upper quadrant. (B) A quantitative analysis of PKH26-calcein–positive myoblasts is shown in the graph as relative percentage (means±SEM) (n=3). **p < 0.01 versus control cells. (C) Fluorescent images were made after coculture for 24 h.
Figure 4. The effects of LiCl on phospho-GSK-3β and total GSK-3β in skeletal myoblasts. (A) Representative immunoblots of phospho-GSK-3β and total GSK-3β from different treatment groups. (B) A quantitative analysis of the ratio of phospho-GSK-3β (Ser9) to total GSK-3β from five independent experiments is shown in the graph. Values are mean±SEM. *p < 0.05 and **p < 0.01 versus control.
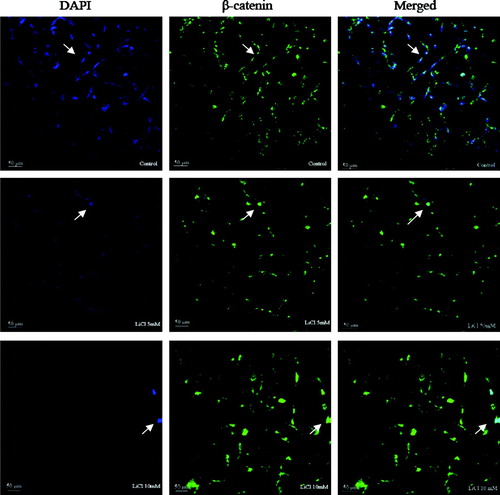
Figure 5. The effect of LiCl on the nuclear localization of β-catenin. β-Catenin localizes at cytomembrane and cytoplasm in control cells, whereas it translocates into nucleus after treatment with 5 and 10 mM LiCl for 24 h. The green channel reflects β-catenin expression and the blue channel reflects DAPI. The green and blue channels are merged for viewing.