Figures & data
Figure 1. The standard curve of IP3 concentration measured by fluorescence polarization. The polarized signal (mP) is inversely proportional to the amount of the IP3. The curve represents fitting of the data to the Hill equation.
Figure 2. Hemichannel-mediated IP3 release in the cochlear sensory epithelium. (A, B) IP3 release by the reduction of extracellular Ca2 + and blockage by gap junction channel blockers. The trace along the x-axis of A shows the procedure of cochlea incubating in different Ca2 + concentrations. The right y-axis indicates the concentration of IP3 released normalized to the cochlear fluid volume (10 µl). (C) The IP3 release under treatment with the P2x receptor blocker PPADS (50 µM), the ABC transporter inhibitor verapamil (Verap; 10 µM), and preincubation with the intracellular calcium chelating reagent BAPTA.
Figure 3. IP3 release in the cochlear sensory epithelium by osmolarity stress and mechanical stimulation. The cochlea was preincubated in normal extracellular solution (300 mOsm) and then switched to be incubated in a hypotonic extracellular solution (275 mOsm). The IP3 release was increased by the hypotonic challenge and blocked by cotreatment with 0.1 mM CBX.
Figure 4. Hemichannel dye uptake assay in the cochlear sensory epithelium. (A, B) LY dye uptake in the cochlear sensory epithelium under low-bivalent condition. A is a phase-contrast image of the epithelium. B is its fluorescence image, which had dye uptake after incubation with LY. (C, D) The epithelial dye uptake was eliminated by elevation of extracellular Ca2 + . The incubation was performed at 10 mM extracellular Ca2 + concentration. (E, F) Dye uptake in dissociated cochlear cells. The supporting pillar cell had dye uptake, but the outer hair cell, which has no connexin expression, did not have dye uptake in the same incubation (indicated by arrows). (G, H) Gap junction blocker blocks dye uptake in the cochlear supporting cell. An isolated cochlear supporting Hensen cell had no dye uptake in coincubation with 100 µM CBX. Scale bars = 100 µm (A to D); 10 µm (E to H).
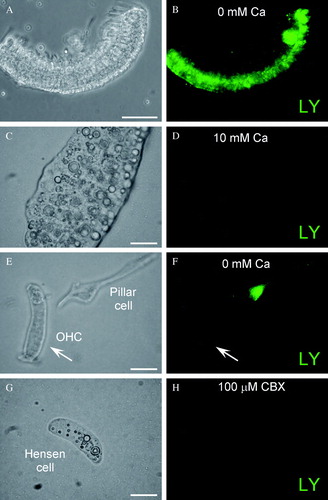
Figure 5. Expression of IP3 receptors (IP3Rs) in the cochlear sensory epithelium. (A, B) Immunofluorescence labeling for IP3R in the cochlear sensory epithelium. (C to F) Expression of IP3Rs in the cochlear-supporting cells. Labeling is visible on the cell surface, in the cytosol, and on the nuclear membrane. Asterisks in E indicate lipid bubbles in Hensen cells that have no IP3R labeling. Scale bars = 50 µm (A, B); 20 µm (C, D); 10 µm (E, F).
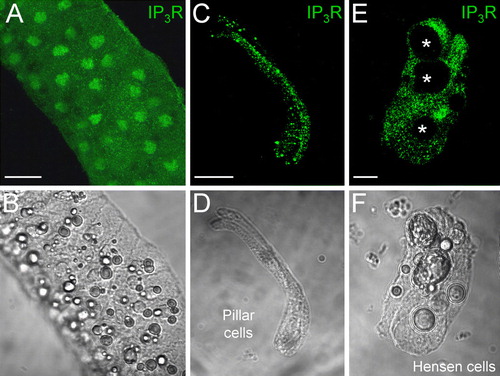
Figure 6. Extracellular IP3 evoked intracellular Ca2 + elevation in the cochlear sensory epithelium. (A) Time-lapse recording of Ca2 + fluorescence images in the cochlear sensory epithelium evoked by extracellular perfusion of 0.1 µM IP3. Scale bar = 20 µm. (B) Ca2 + fluorescence intensity in the cochlear sensory epithelium was continuously recorded. Horizontal bars represent extracellular perfusion of 0.1 µM IP3. (C) Blockage of Ca2 + elevation by coapplication of CBX. CBX eliminated the extracellular IP3-triggerred elevation in intracellular Ca2 + concentration. The sensory epithelium was coincubated with 0.1 mM CBX. Note a small increase at the beginning of the IP3 perfusion induced by perfusion-induced mechanical disturbance.
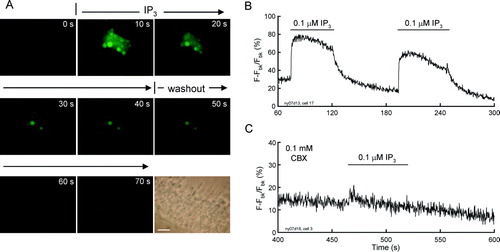
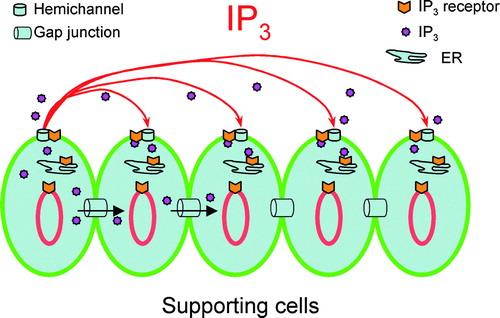
Figure 7. Schematic drawing of hemichannel-mediated intercellular signaling pathway in the cochlea. IP3 can pass through not only intact gap-junctional channels but also hemichannels to participate in intercellular signaling.