Figures & data
Table 1. Characteristics of AML-/MDS-pts (age, gender, FAB-type, stages of the disease and response to immunotherapy) and samples used as stimulator cells (blast containing MNC or DCleu containing DC) or as effector cells (T-cells: allogeneic, autologous, after SCT) in mixed lymphocyte cultures.
Figure 1. Kinetic of cytokines in serum of AML-/MDS-patients and in MLC-supernatants of T-cells after ‘DC’-stimulation (results with autologous, allogeneic T-cells or T-cells after SCT pooled). Median cytokine concentrations in serum and during different phases of MLC after stimulation with ‘DC’ are given as box-and-whisker plot. The ends of the whiskers represent the minimum and maximum of all of the data. The ordinate is presented as logarithmic scale to the base 10. Z1: Serum (n = 16), Z2: first restimulation of MLC (n = 19), Z3: second restimulation of MLC (n = 19), Z4: cell harvest of MLC (n = 11).
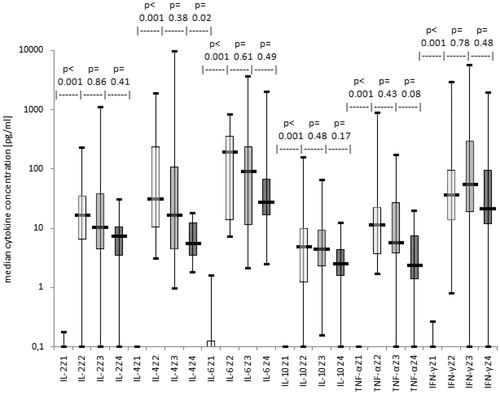
Figure 2. Correlation of anti-leukaemic T-cell activity with cytokine release patterns after stimulation with ‘DC’ (results with autologous, allogeneic T-cells or T-cells after SCT pooled). Median cytokine concentrations are given with cases subdivided in cases with or without gain of anti-leukaemic lytic activity after ‘DC’-stimulation as box-and-whisker plot. The ends of the whiskers represent the minimum and maximum of all of the data. The ordinate is presented as logarithmic scale to the base 10. (a) At second restimulation of MLC: cases with lysis (n = 7), cases with no lysis (n = 9), (b) At cell harvest of MLC: cases with lysis (n = 5), cases with no lysis (n = 3).
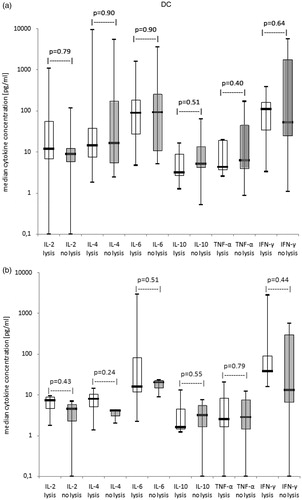
Figure 3. Cytokine release patterns in MLC-supernatants in correlation with clinical response vs. non response to immunotherapy (results with allogeneic T-cells or T-cells after SCT pooled). Median cytokine concentrations in MLC-supernatants of T-cells after ‘DC’-stimulation in cases subdivided in cases with or without clinical response to immunotherapy are given as box-and-whisker plot. The ends of the whiskers represent the minimum and maximum of all of the data. The ordinate is presented as logarithmic scale to the base 10. (a) At second restimulation of MLC: responders to immunotherapy (resp. n = 8), non responders to immunotherapy (no resp. n = 5), (b) At cell harvest of MLC: responders to immunotherapy (resp. n = 4), non responders to immunotherapy (no resp. n = 2)
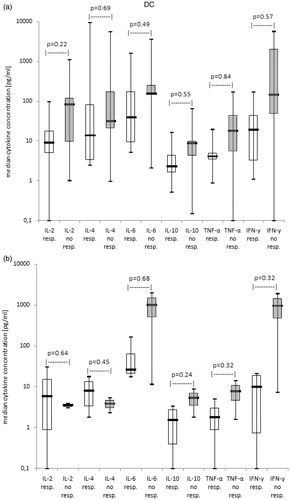
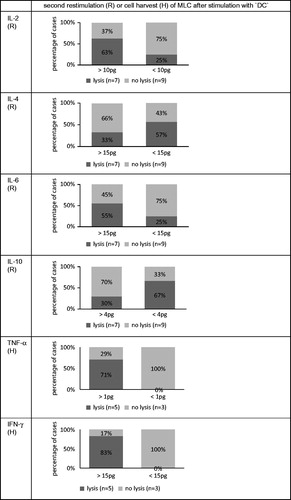
Figure 4. Predictive values of cytokine concentrations for antileukaemic lytic capability of T-cells after stimulation with ‘DC’: cut-off analyses. Correlations of cytokine concentrations with antileukaemic lytic activities of T-cells are given at second restimulation (R) or at cell harvest (H) of MLC with ‘DC’, as available (results with autologous, allogeneic T-cells or T-cells after SCT pooled). All cases were separated in two prognostic groups evaluating a cut-off value for the best differentiation of cases into those with or without antileukaemic activity.