Figures & data
Figure 1. Knockdown of the receptor for AGE (RAGE) inhibits advanced glycation end-products (AGEs)-induced intracellular reactive oxygen species (ROS) formation in HUVECs. (A) Examination of the receptor for advanced glycation end products (RAGE) expression upon knockdown with siRNA, assessed by real-time polymerase chain reaction (PCR) and Western blot. (B) The effect of AGEs on RAGE mRNA expression, with or without knockdown of RAGE. (C) HUVECs were transfected with non-silencing control siRNA or RAGE-specific siRNA for 48 h, then stimulated with BSA or glycol-AGEs for 24 h. The level of RAGE was analyzed by immunofluorescence staining. (D) Effect of an NADPH oxidase inhibitor (apocynin, 10 μM) and a mitochondrial respiratory chain complex inhibitor (rotenone, 10 μM) on glycol-AGEs-dependent ROS generation in HUVECs. (E) Examination of the effects of glycol-AGEs on ROS formation in RAGE knockdown HUVECs 48 h post-transfection. NC, non-silencing control; siRAGE, RAGE-specific siRNA. Bars with different letters (a, b, c, and d) differ significantly from each other (p < .001).
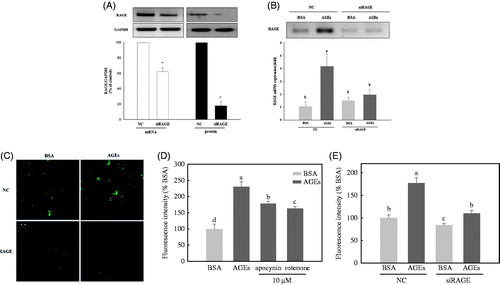
Figure 2. Activation of extracellular signal-regulated kinases (ERK), c-jun N-terminal kinase (JNK) and p38 mitogen-activated protein kinase (p38 MAPK) downstream of RAGE. HUVECs were transfected with non-silencing control siRNA or RAGE-specific siRNA for 48 h before glycol-AGEs treatment. The phosphorylation levels and total protein levels of ERK, JNK, and p38 MAPK were examined by Western blot analysis. Knockdown of RAGE attenuated AGEs-induced phosphorylation of ERK, but not JNK or p38 MAPK. Levels of phospho-active kinases relative to total kinases are shown in the bar graphs. Values represent mean ± S.D. siCon, non-silencing control; siRAGE, RAGE-specific siRNA. Bars with different letters (a, b, c, and d) differ significantly from each other (p < .05).
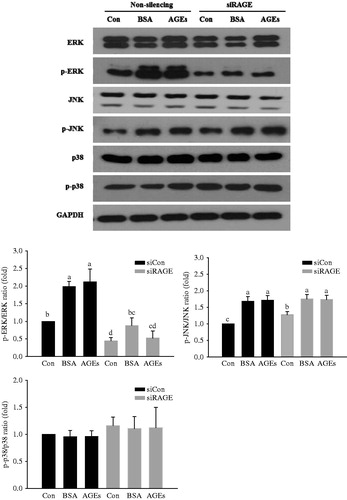
Figure 3. Activation of nuclear factor kappa B (NF-κB) is responsible for AGEs-induced RAGE expression. (A) HUVECs were transfected with non-silencing control siRNA or RAGE-specific siRNA, and then treated with 100 μg/mL glycol-AGEs for 1 h. The nuclear fraction was used to analyze the concentration of p65, a subunit of NF-κB. Western blot showed that glycol-AGEs induced nuclear translocation of NF-κB, which was inhibited by RAGE knockdown in HUVECs. Proliferating cell nuclear antigen (PCNA), and GAPDH served as the internal controls. The bar graph shows the ratio of NF-κB localization from the cytoplasm to the nucleus, assessed using ImageJ software. (B) Examination of the translocation of p65 into nuclei via immunofluorescence staining. HUVECs were treated with 100 μg/mL glycol-AGEs for 1 h, and then stained with an antibody against p65 (green). Nuclei were stained with DAPI (blue). siCon, non-silencing control; siRAGE, RAGE-specific siRNA. Images were taken by confocal microscopy. Magnification: 100×.
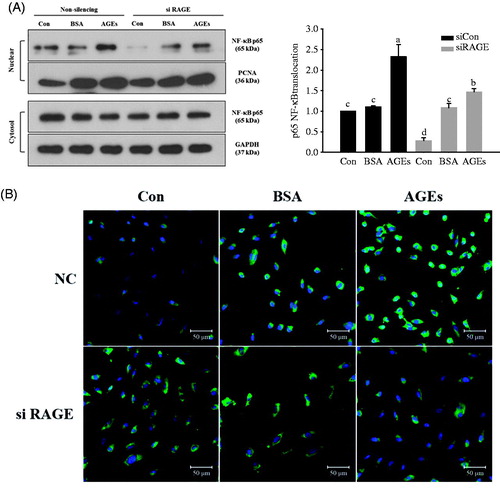
Figure 4. Expression of pro-inflammatory cytokines in co-culture with HUVECs and THP-1 cells. HUVECs and THP-1 cells were co-cultured with VSMCs for 24 h after transfection with non-silencing control siRNA or RAGE-specific siRNA for 24 h. The cells were then stimulated with 100 μg/mL of glycol-AGEs for 4 h, and HUVECs and THP-1 cells were collected from the media in the upper insert. The bar graphs show the quantification of cytokine expression levels. The mRNA expressions of RAGE, tumor necrosis factor (TNF)-α and interleukin (IL)-1β are shown as fold changes (mean ± S.D.) compared with those of BSA-treated non-silenced controls. EC siRAGE, knock-down RAGE in HUVECs; EC/THP-1 siRAGE, knock-down RAGE in both HUVECs and THP-1 cells. Bars with different letters (a, b, c, and d) differ significantly from each other (p < .05).
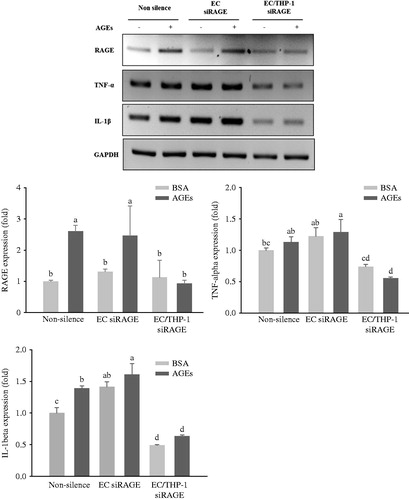
Figure 5. Expression of inflammatory cytokines in transfected HUVECs and THP-1 monocytic cells co-cultured with VSMCs. HUVECs and THP-1 cells were co-cultured with VSMCs for 24 h after transfection with non-silencing control siRNA or RAGE-specific siRNA for 24 h. The co-cultivated cells were then stimulated with 100 μg/mL of glycol-AGEs for 24 h, and then the VSMCs were collected from the lower sides of the co-cultures. The mRNA expression levels of RAGE, IL-6, monocyte chemoattractant protein (MCP)-1, and plasminogen activator inhibitor (PAI)-1 are shown as fold changes (mean ± S.D.) compared with those in BSA-treated non-silenced controls. The bar graphs show the quantification of cytokine expression, normalized to the corresponding value for GAPDH mRNA. EC siRAGE, knock-down RAGE in HUVECs; EC/THP-1 siRAGE, knock-down RAGE in both HUVECs and THP-1 cells. Bars with different letters (a, b, and c) differ significantly from each other (p < 0.05).
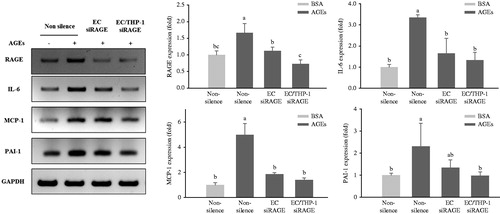
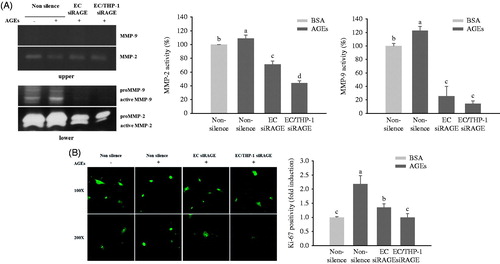
Figure 6. Effects of AGEs on MMP expression and VSMC proliferation. HUVECs and THP-1 cells were co-cultured with VSMCs for 24 h after being transfected with non-silencing control siRNA or RAGE-specific siRNA. They were then treated with BSA or glycol-AGEs (100 μg/mL) for another 24 h. (A) Gelatin zymogram revealing the effects of glycol-AGEs and RAGE knockdown on inducible MMP-2 and MMP-9 activities in conditioned medium from co-cultures with HUVECs and THP-1 cells (upper), VSMCs (lower), the lower compartment was used to perform image analysis. (B) Effects of glycol-AGEs on VSMC proliferation (Ki-67 expression) induced by co-culture with HUVECs and THP-1 cells. The cells were stained with primary Ki-67 antibody and Alexa fluor® conjugated (green) secondary antibody. Magnification: 100 × (top), 200 × (bottom). Lower panels, statistical analysis of Ki-67 cell positivity as fold induction compared to the BSA-treated non-silenced control group. Each value represents the mean ± S.D. of three independent determinations. EC siRAGE, knock-down RAGE in HUVECs; EC/THP-1 siRAGE, knock-down RAGE in both HUVECs and THP-1 cells. Bars with different letters (a, b, c, and d) differ significantly from each other (p < .05).