
Figures & data
Table 1. Compositions of soft, medium and hard PAAM hydrogels.
Table 2. Parameters used for SCFS experiments.
Figure 1. A typical force-displacement curve for a SCFS test: approach curve (black) and retract curve (grey). In the approach region, initially there is no cell-surface contact (Approach 1), then the cell meets the bottom of petri dish and squeeze between the cantilever, and dish surface (Approach 2). In the retract part, Retraction 1 contains several information about cell-substrate adhesion, including maximum detachment force, detachment work, and unbinding force of molecular bonds. Finally, there is no more cell-surface contact (Retraction 2).
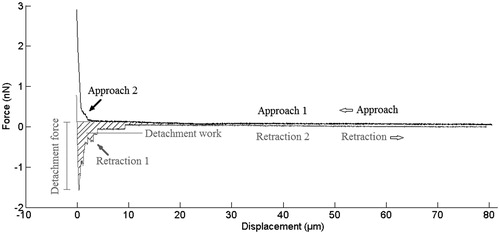
Figure 2. Elastic modulus of soft, medium and hard substrates.
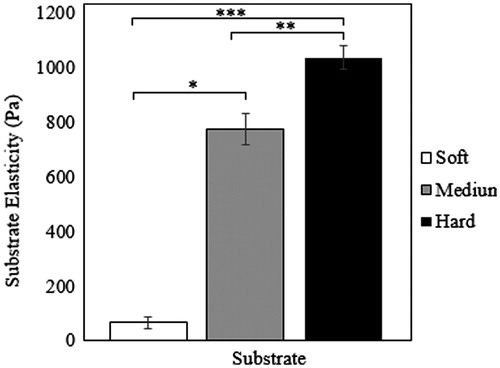
Figure 3. Morphology of cells cultured on (A) soft, (B) medium and (C) hard polyacrylamide substrates after 24 h, and (D) hard substrate after 48 h. Experiments were performed in triplicate.
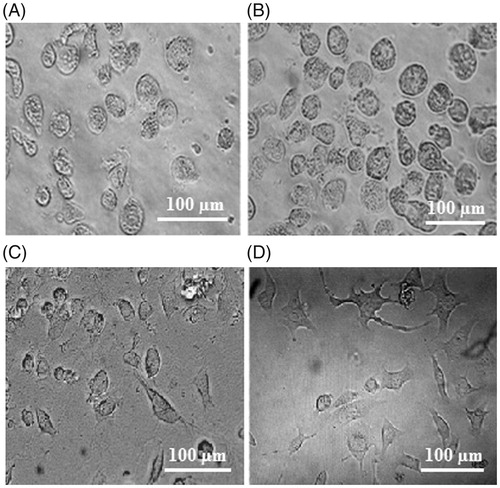
Figure 4. Actin staining for (A) soft and (B) hard substrates.
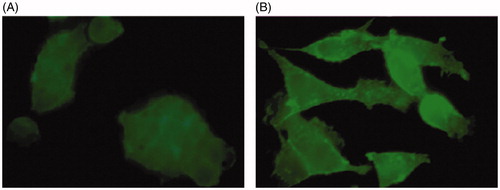
Figure 5. Cell elasticity and detachment force values corresponding to the soft, medium, and hard polyacrylamide substrates. *, **, and *** indicate significant difference (p < 0.05).
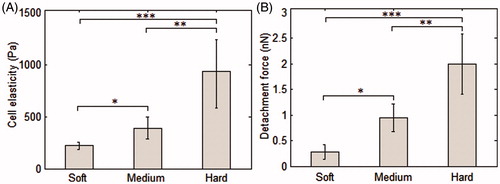
Table 3. Force spectroscopy results for soft, medium, and hard substrates based on 120 SCFS experiments using 11 cells.