Figures & data
Figure 1. Establishment of CAF-SA. (A) Left: A single cell in a well (white arrows). Middle: Expanded cells. Right: Subcultured CAF-SA. Scale bar =500 μm. (B) The biomarker expression of CAF-SA. Cell were negative for Pan CK and α-SMA and positive for VIM, FSP-1 and FAP. Scale bar =50 μm.
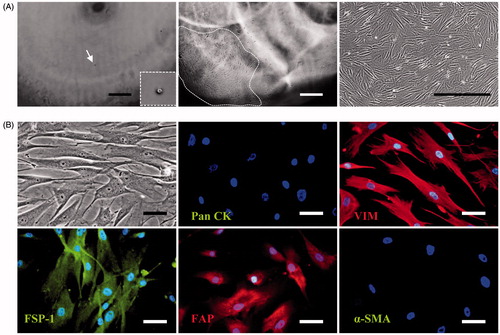
Table 1. STR profiling of CAF-A1 and CAF-SA.
Figure 2. CAF-SA promoted the migration and invasion of SACC cells. (A,B) Wound-healing assay. CAF-SA-CM promoted SACC-83 (A) and SACC-LM (B) migration significantly more than the control medium. (*p < .05. Scale bar = 200 μm) (C) SACC invasion assay using Transwell plates. CAF-SA-CM promoted SACC-83 and SACC-LM invasion significantly more than the control medium. (**p < .01. Scale bar = 200 μm). (D) SACC invasion assay using a microfluidic model. CAF-SA-CM promoted SACC-83 and SACC-LM invasion significantly more than the control medium. (**p < .01. Scale bar = 100 μm).
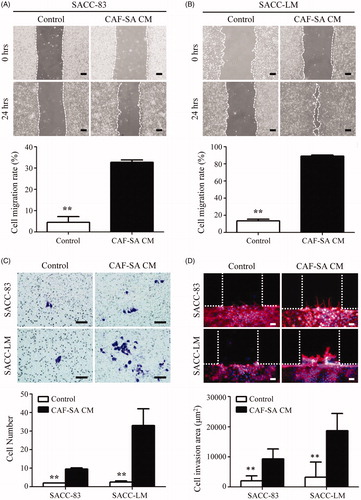
Figure 3. Clonogenic assay and tube formation assay. (A) Clonogenic assay. Representative images of colonies stained with crystal violet. (B) Quantification of clonogenic assay. CAF-SA-CM promoted SACC-83 and SACC-LM colony formation significantly more than the control medium. (*p < .05, **p < .01). (C) Tube formation assay. CAF-SA-CM promoted tube formation greatly. Scale bar = 100 μm.
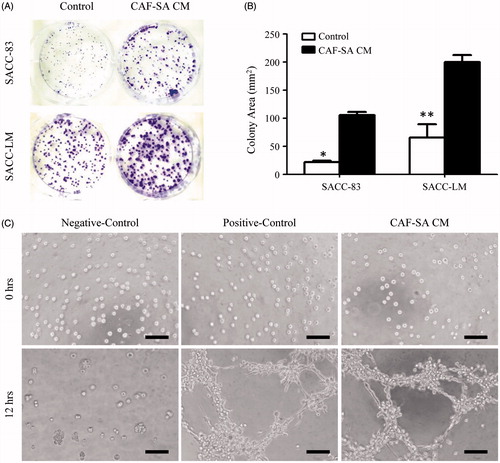
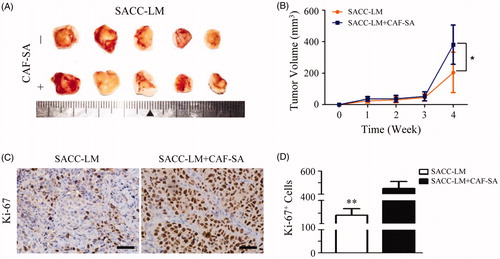
Figure 4. CAF-SA promotes SACC growth in nude mouse models. (A) Photos of SACC-LM xenografts with or without CAF-SA. (B) Tumor volume analysis. CAF-SA-CM promoted SACC-LM growth significantly at Week 4, compared to controls (n = 5, two transplanted sites/nude mouse, *p < .05). (C) Typical xenografts of SACC-LM transplanted with or without CAF-SA after Ki67 immunostaining. Scale bar = 50 μm. (D) Quantification of Ki-67 staining. Positive cells significantly increased in the SACC-LM + CAF-SA group, compared to the SACC-LM group. (**p < .01).