Figures & data
Figure 1. Contour plot of the region defined by EquationEquation (17)
(17)
(17) in the
-plane with
, and
When
the values of
and m7 are bounded by the outer large irregular rectangle.
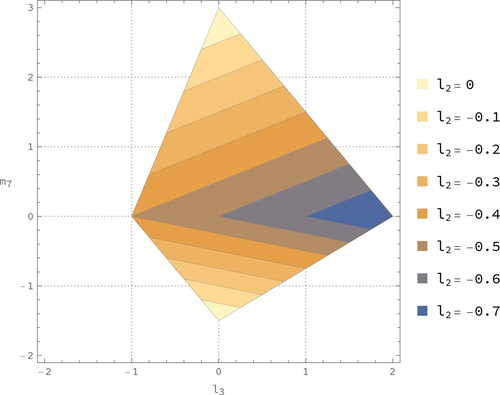
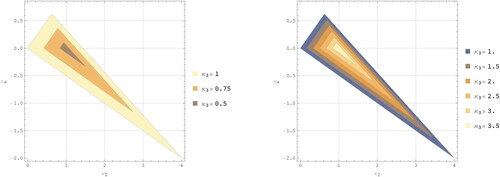
Figure 2. Contour plots of the region defined by EquationEquation (23)
(23)
(23) with
in the
-plane. The left-hand plot is for the case
while the right-hand plot is for the case