Figures & data
Figure 1. Schematic illustration of the photorefractive effect mechanism. (1) Two laser beams interfere in the photorefractive material, (2) charge generation occurs in the light areas of the interference fringes, (3) electrons are trapped at the trap sites in the light areas, holes migrate by diffusion or drift in the presence of an external electric field and generate an internal electric field between the light and dark positions and (4) the refractive index of the corresponding area is altered by the internal electric field that is generated.
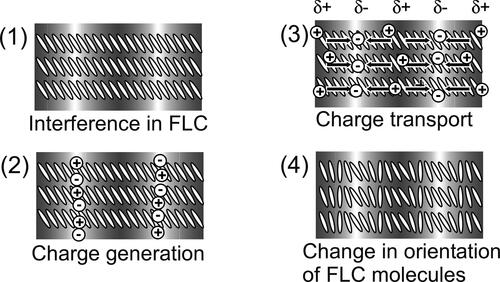
Figure 2. Structures of the photoconductive chiral compounds (3 T-2MB and 3 T-2OC), achiral photoconductive chiral compound 3 T-B, electron trap reagent TNF and smectic LC compounds.
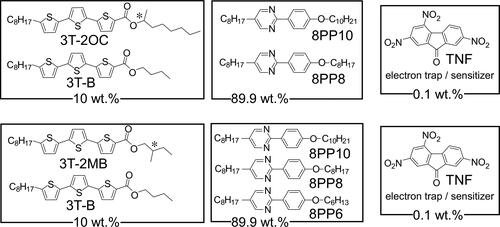
Figure 3. Texture of the homeotropically oriented base-LC (1:1:2 mixture of 8PP10, 8PP8 and 8PP6) observed under polarized microscope at room temperature (27 °C). A 5 µm gap glass cell with homeotropic alignment layer (cetyltrimethylammonium bromide) was used. The base-LC was injected to the cell at isotropic temperature and gradually cooled to room temperature.
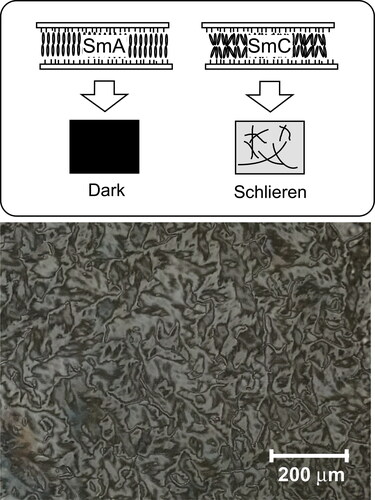
Figure 4. Schematic illustration of the beam incidence in the two-beam coupling experiment and the structure of the LC cell used in this study.
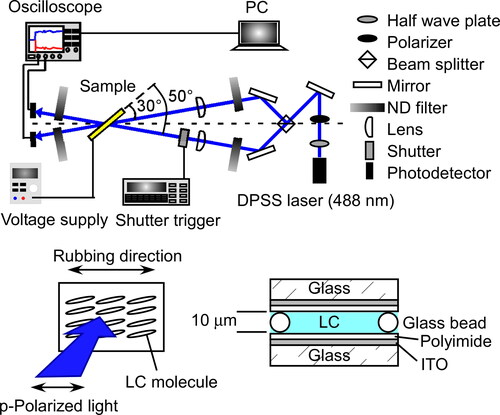
Table 1. Phase transition temperatures of base-LCs.
Figure 5. Typical result of two-beam coupling experiments for an LC blend measured at 30 °C for a mixture of 8PP10, 8PP8 and 8PP6 (1:1:2), TNF (0.1 wt.%) and 3 T-2MB (10 wt.%). An electric field of 2 V/µm was applied to the sample.
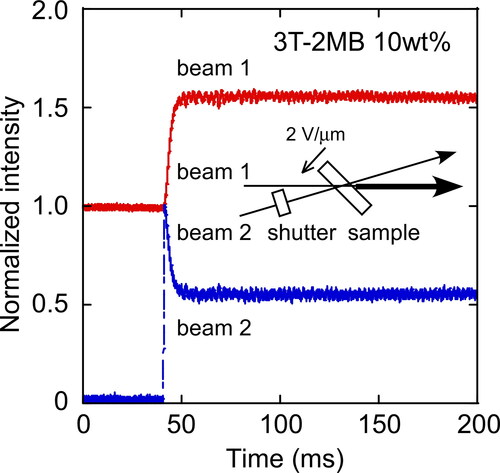
Figure 6. (a) Dependence of the magnitude of the gain coefficient on the concentration of the photoconductive chiral compound 3 T-2OC (without 3 T-B). (b) Dependence of the refractive index grating formation time on the concentration of 3 T-2OC. (c) Dependence of the magnitude of the gain coefficient on the concentration of the photoconductive chiral compound 3 T-2MB (without 3 T-B). (d) Dependence of the refractive index grating formation time on the concentration of 3 T-2MB. An electric field of 2 V/µm was applied to the sample. The measurement was conducted at room temperature.
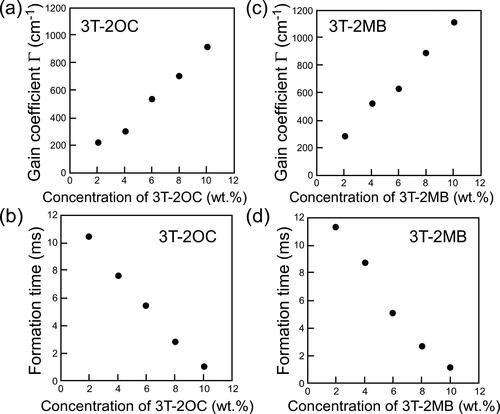
Figure 7. Gain coefficients and refractive index grating formation times of LC blends containing a photoconductive mixture (3 T-2OC and 3 T-B). (a) Dependence of the magnitude of the gain coefficient on the concentration of the chiral unit (3 T-2OC). (b) Dependence of the refractive index grating formation time on the concentration of the chiral unit. The concentration of the photoconductive chromophore (terthiophene) was kept constant (10 wt.%). An electric field of 2 V/µm was applied to the sample. The measurement was conducted at room temperature.
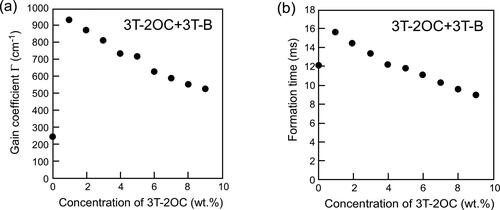
Figure 8. Gain coefficients and refractive index grating formation times of LC blends containing a photoconductive mixture (3 T-2MB and 3 T-B). (a) Dependence of the magnitude of the gain coefficient on the concentration of the chiral unit (3 T-2MB). (b) Dependence of the refractive index grating formation time on the concentration of the chiral unit. The concentration of the photoconductive chromophore (terthiophene) was kept constant (10 wt.%). An electric field of 2 V/µm was applied to the sample. The measurement was conducted at room temperature.
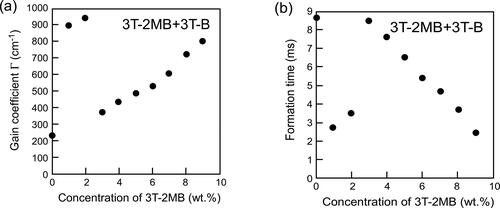
Figure 9. Phase diagrams of base LC mixtures and photoconductive chiral compounds. The concentration of the photoconductive chromophore (terthiophene) was kept constant (10 wt.%) using an achiral photoconductive compound 3 T-B. (a) Phase-transition temperatures of the LC blend of a binary mixture of base-LC (1:1 mixture of 8PP10 and 8PP8), 3 T-2OC and 1 wt.% of TNF as a function of the concentration of 3 T-2OC. (b) Phase-transition temperatures of the LC blend of a ternary mixture of base-LC (1:1:2 mixture of 8PP10, 8PP8 and 8PP6), 3 T-2MB and 1 wt.% of TNF as a function of the concentration of 3 T-2MB.
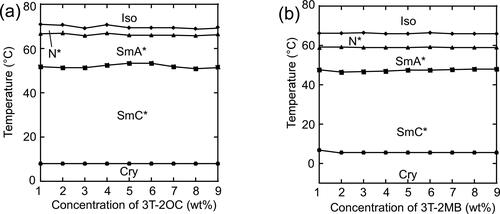
Figure 10. Spontaneous polarization of LC blends measured by a triangular waveform voltage method. A triangular waveform voltage of +10 V and -10 V with a frequency of 50 Hz was applied to 10-mm thick samples. •: Mixture of 8PP10, 8PP8 and 8PP6 (1:1:2), TNF (0.1 wt.%) and 3 T-2MB. ▪: Mixture of 8PP10 and 8PP8 (1:1), TNF (0.1 wt.%) and 3 T-2OC. The concentration of the photoconductive chromophore (terthiophene) was kept constant (10 wt.%). The measurement was conducted at room temperature.
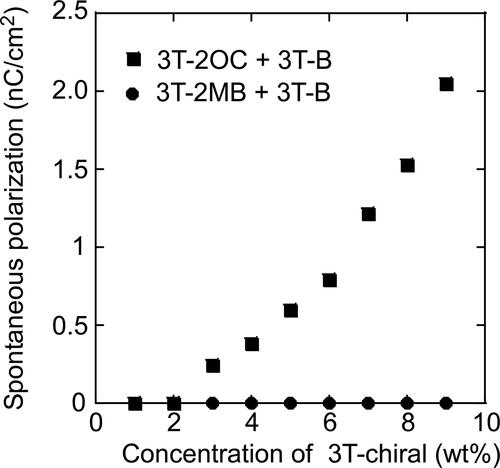
Figure 11. Soft mode and Goldstone mode.
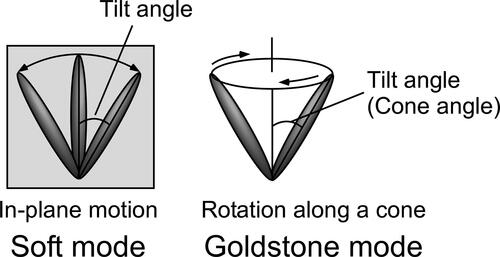
Figure 12. (a) Cole–Cole plots of LC blends containing various concentrations of 3 T-2OC, showing the variation of the loss (ε”) with the permittivity (ε’). The concentrations of the photoconductive chiral compound (3 T-2OC) are shown in the figure legend. The total concentration of the photoconductive chromophore (terthiophene) was kept at 10 wt.%. The measurement was conducted at room temperature. (b) Frequency dependence of the loss (ε”) and the permittivity (ε’). The concentration of 3 T-2OC was 7 wt.%.
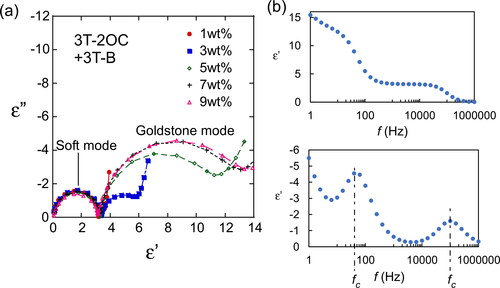
Figure 13. Cole–Cole plots of LC blends containing various concentrations of 3 T-2MB showing the variation of the loss (ε”) with the permittivity (ε’). The concentrations of the photoconductive chiral compound (3 T-2MB) are shown in the figure legend. The total concentration of the photoconductive chromophore (terthiophene) was kept at 10 wt.%. The measurement was conducted at room temperature. (b) Frequency dependence of the loss (ε”) and the permittivity (ε’). The concentration of 3 T-2MB was 7 wt.%.
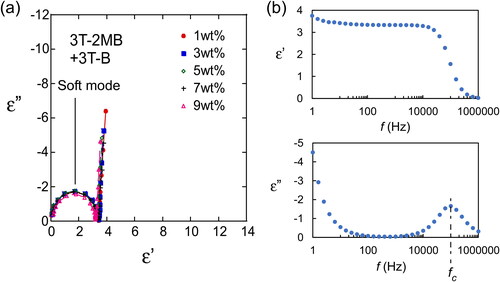
Figure 14. (a) Texture of the LC blend containing 3 T-2MB (2 wt.%) in a 10 µm thick cell observed under polarizing microscope at room temperature (27 °C). (b) Dependence of the helical pitch length on the concentration of the photoconductive chiral compounds. The concentration of the photoconductive chromophore (terthiophene) was kept at 10 wt.%. The measurement was conducted at room temperature.
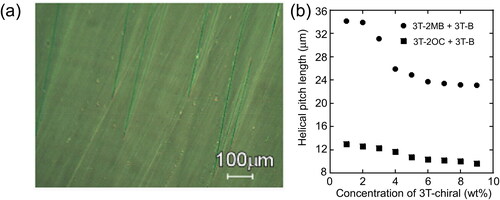
Figure 15. Dependence of the switching angle of LC molecules on the applied electric field. The switching angles were measured on LC blends containing 3 T-2OC and 3 T-B. The concentration of 3 T-2MB is given in the figure legend. The concentration of the photoconductive chromophore (terthiophene) was kept constant (10 wt.%).
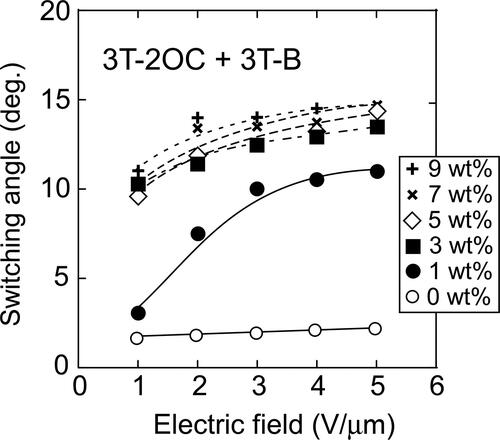
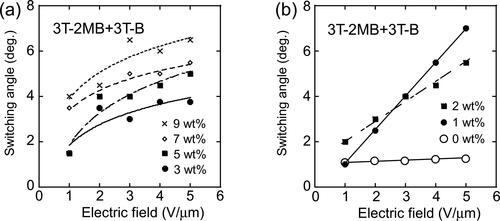
Figure 16. Dependence of the switching angle of LC molecules on the applied electric field. (a) Switching angles measured on LC blends containing 3 T-2MB and 3 T-B. (b) Switching angles measured on LC blends with 3 T-2MB concentrations lower than 2 wt.%. The concentration of 3 T-2MB is given in the figure legend. The concentration of the photoconductive chromophore (terthiophene) was kept constant (10 wt.%).