
Figures & data
Figure 1. The six conformers with the lowest energy, obtained by conformational analysis of the edotecarin molecule.
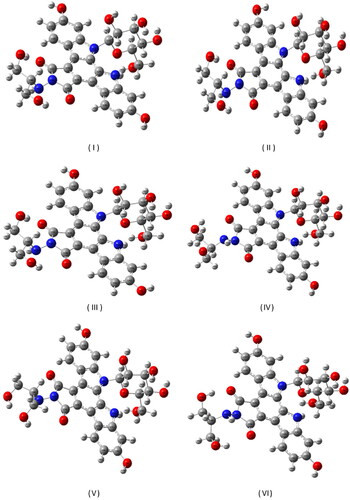
Table 1. The energies of the six most stable conformation obtained by conformation analysis.
Table 2. The dihedral angles differing in the six low energy conformers obtained by conformational analysis.
Figure 2. The most stable geometric structure of the edotecarin molecule obtained with the DFT/B3LYP/6-31++G(d,p) level of theory.
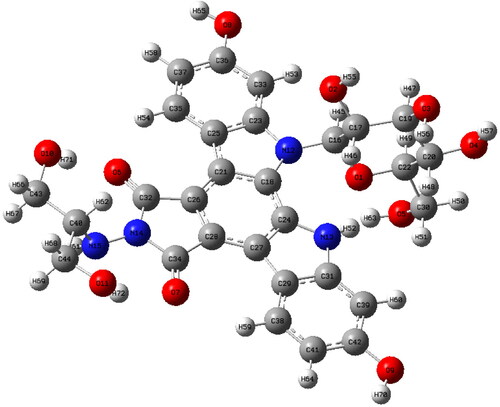
Table 3. Edotecarin's optimized geometry parameters * were calculated using 6-31++G(d,p) basis set at DFT/B3LYP level of theory.
Table 4. Comparison between the optimized parameters of the edotecarin molecule and the experimental [Citation20, Citation21] parameters of the carbazole molecule and also the theoretical [Citation22] parameters of the geometric 4-hydroxy carbazole molecule.
Figure 3. Molecular electrostatic potential (MEP) of Edotecarin obtained by DFT/B3LYP/6- 31++G(d,p).
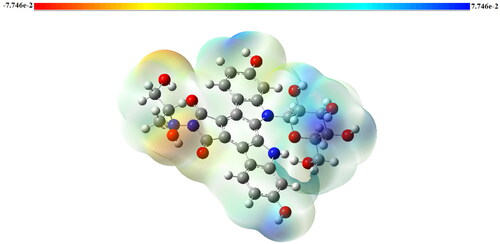
Figure 4. Calculated IR (a) and Raman (b) spectra of Edotecarin.
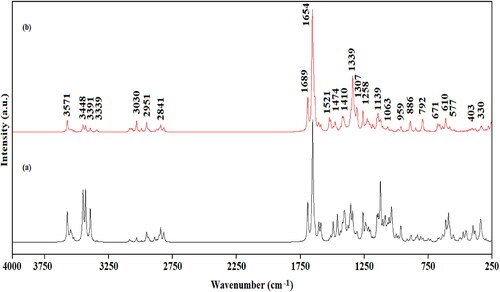
Table 5. Calculated wavenumbers (cm-1), calculated IR, Raman intensities (I) and the potential energy distribution of the vibrational modes of the Edotecarin.
Figure 5. The atomic orbital HOMO-LUMO composition of the frontier molecular orbital for Edotecarin.
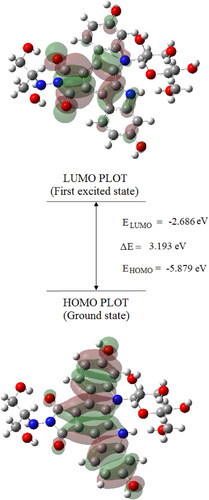
Table 6. Selected calculated positions of the pure electronic transitions, oscillator strengths (f) and major contributions.
Figure 6. Molecular docked models of edotecarin with DNA (a),The interactions between the edotecarin and DNA are labeled using colored dashed lines(b) (-8.1 kcal/mol).
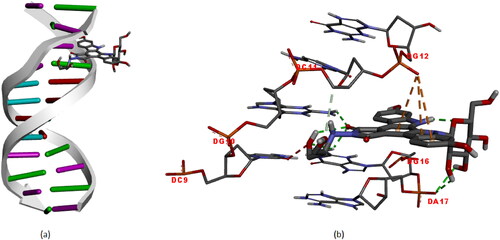
Figure 7. (a) and (b) Different representations of Edotecarin docking with TOPI. Dotted lines indicate interactions (-8.9 kcal/mol).
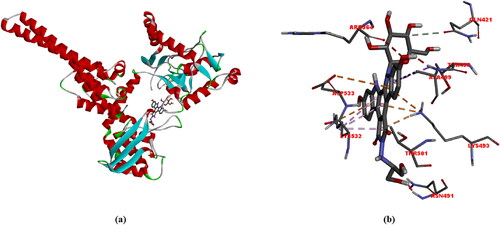
Figure 8. (a) Structural model of DNA-TOPI complexes with ligand edotecarine binding site (green sphere), (b)The interactions between the edotecarin and DNA-TOPI complexes are labeled using colored dashed lines (-10.7 kcal/mol).
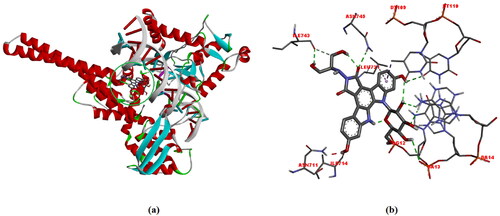
Figure 9. The 3 D docked view of the optimized structure of edotecarin in α5β1 integrin. The ligand interaction diagrams of receptor ligand complexes are Show (binding affinity -9.1 kcal/mol).
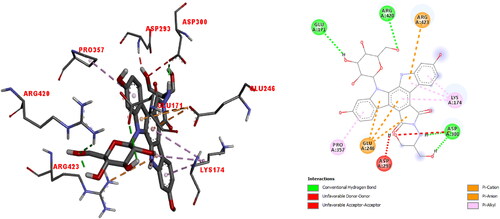
Figure 10. The 3 D docked view of the optimized structure of edotecarin in αIIbβ3 integrin. The ligand interaction diagrams of receptor ligand complexes are Show (binding affinity -7.9 kcal/mol).
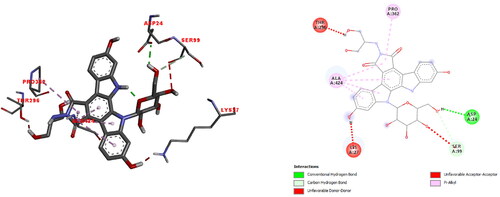
Table 7. Osiris's estimation of title compounds toxicity hazards and physicochemical properties.
Table 8. Prediction of ADMET profiles of the edotecarin ADMET predicted profile – classification.