Figures & data
Figure 1. Typical timing chart of the LCD for VR with 1700 lines driven at 90 Hz.
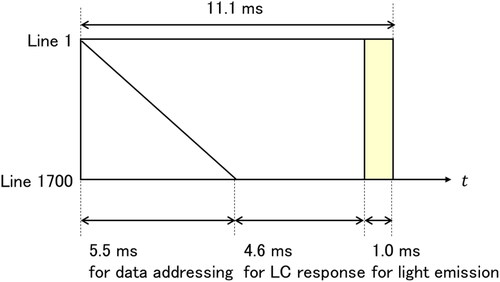
Figure 2. FOV vs. ppd.
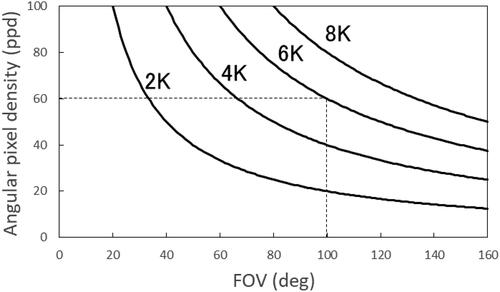
Figure 3. Conflict in visual representation between accommodation and convergence.
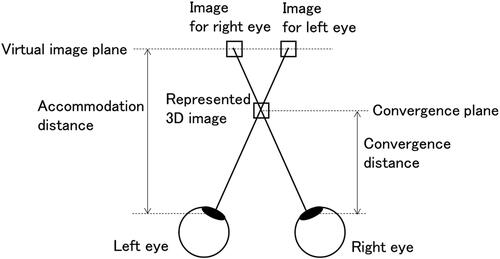
Figure 4. Cross-sectional and top views of SLC-IPS LCD and conventional IPS-LCD. Red dotted lines denote the imaginary boundary.
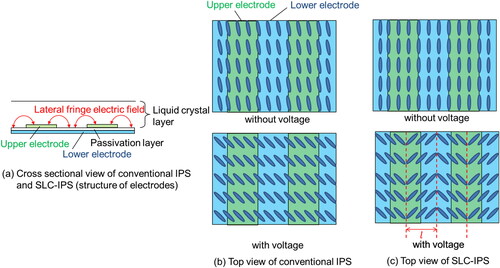
Figure 5. Optical response properties of SLC-IPS and conventional IPS.
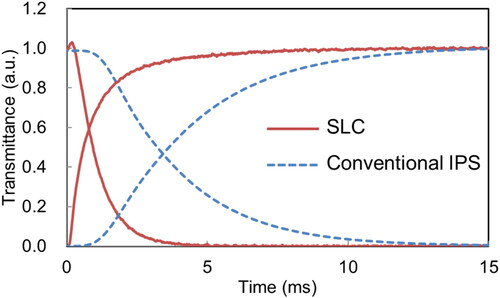
Figure 6. Optical decay response time (90% to 10%) of SLC-IPS as a function of distance
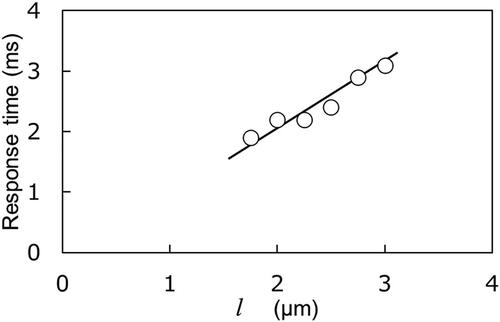
Figure 7. GTG response times of the developed LCD using SLC-IPS.
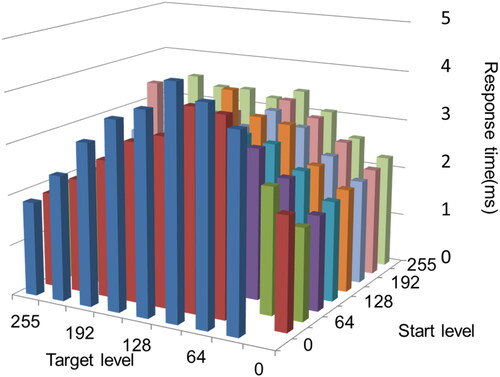
Table 1. Specifications for the developed LCD using SLC-IPS.
Figure 8. Optics of the liquid crystal lens.
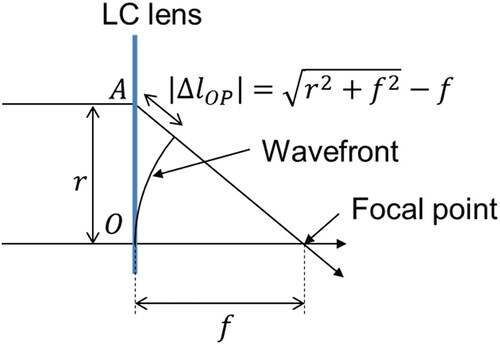
Figure 9. Director configuration of the LC lens.
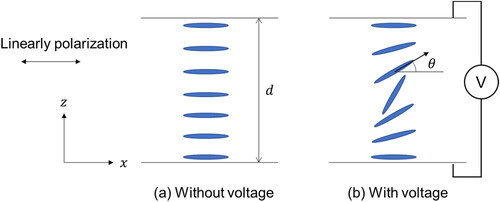
Figure 10. OPD profiles of the LC lens: (a) focal length of with high applied voltage at the periphery, (b) focal length of
with high applied voltage at the center.
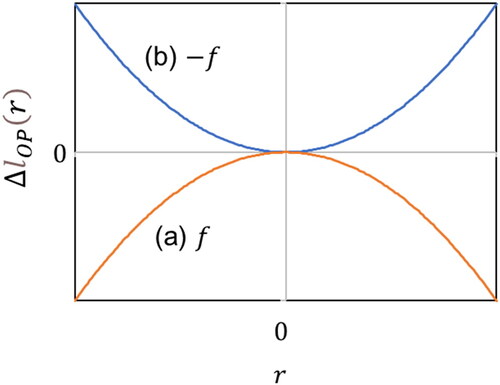
Figure 11. Concentric ring electrode structure.
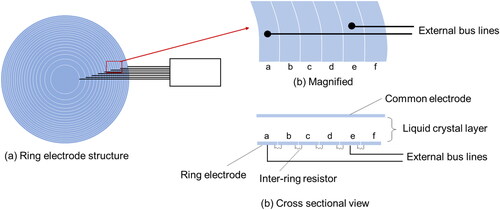
Figure 12. Fresnel LC lens.
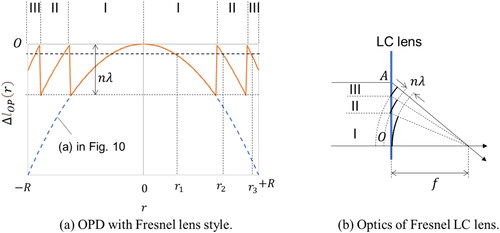
Figure 13. Pancharatnam–Berry lens (PBL).
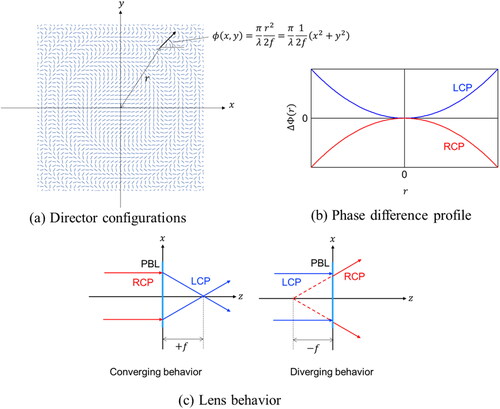
Figure 14. Optics of the Pancharatnam–Berry phase deflector (PBD).
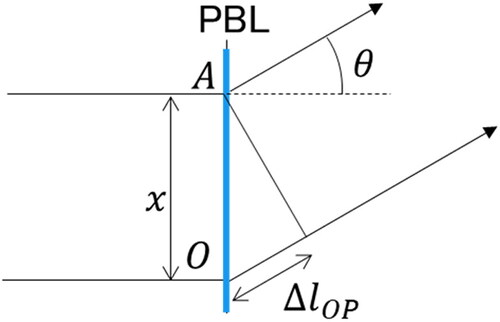
Figure 15. Pancharatnam–Berry deflector (PBD).
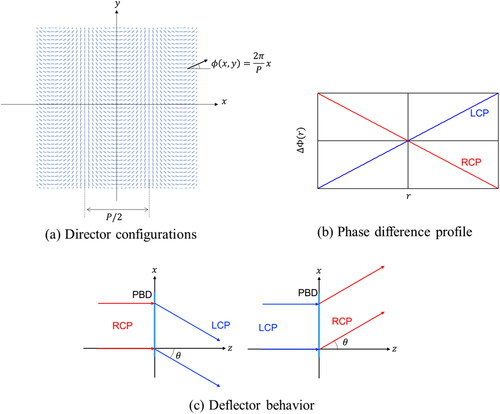
Figure 16. Active driving and passive driving of PBL.
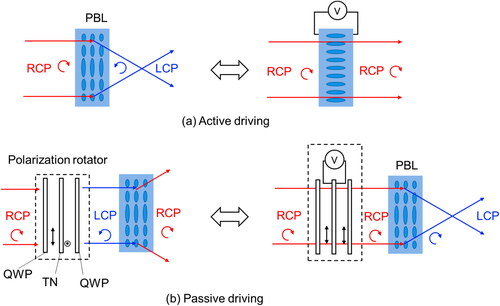
Figure 17. Stack of active PBLs.
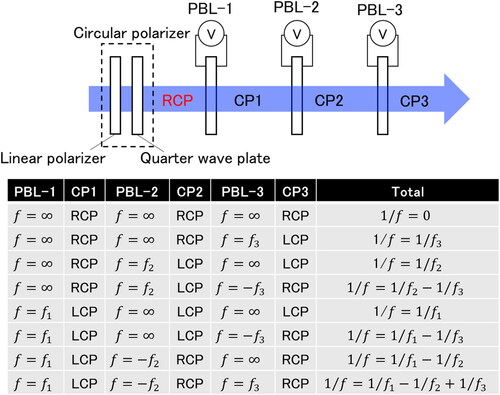
Figure 18. Stack of passive PBLs.
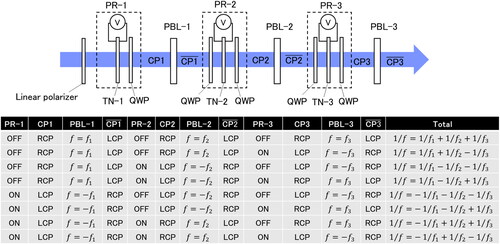
Figure 19. Principle of geometric phase doublet lens, or doublet PBL.
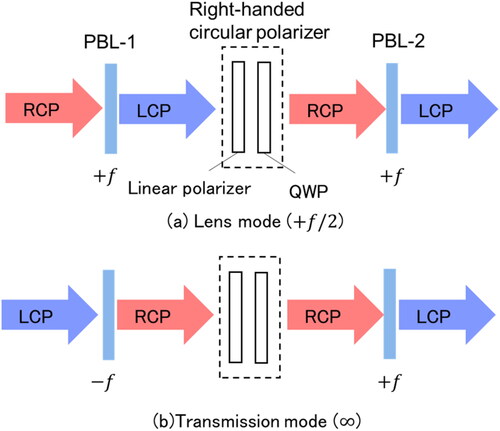
Figure 20. Optical setup of interferometry for PBL.
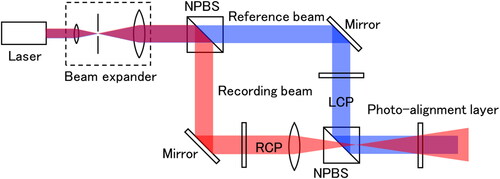
Figure 21. Optical setup of interferometry for PBD.
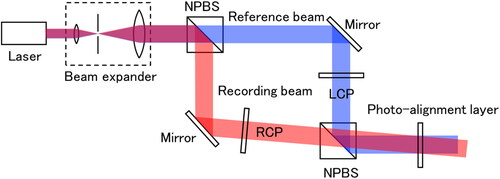
Figure 22. Director configurations of PVG.
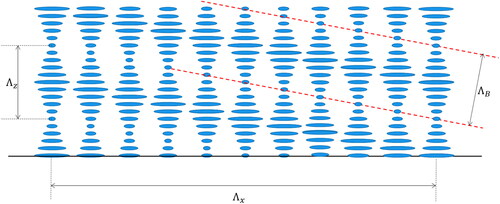
Figure 23. Compact HMD for AR with PBLs and PVGs.
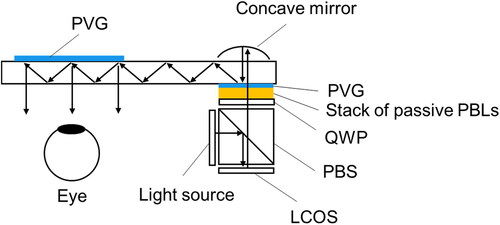
Figure 24. Optics that double pixel density.
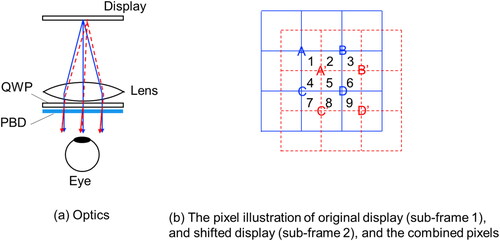
Figure 25. Optics of the PB doublet lens for AR.
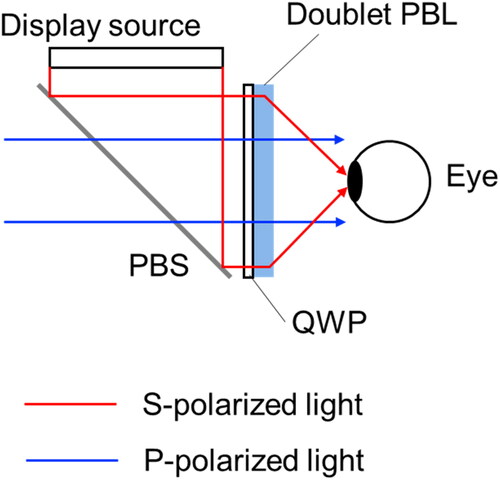
Figure 26. Foveated display system based on doublet PBLs.
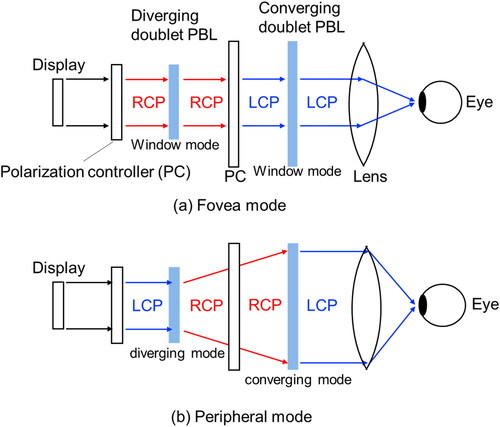
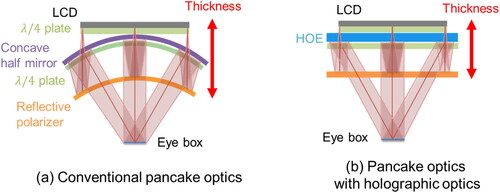
Figure 27. Pancake optics.
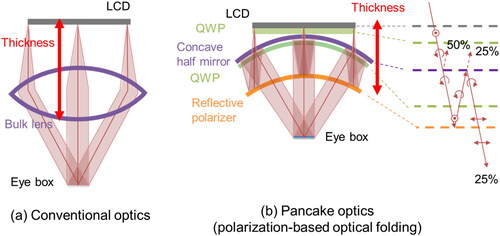
Figure 28. Proposed pancake optics with CLC lens.
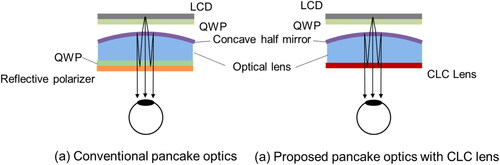
Figure 29. Pancake optics combined with holographic optics.