Figures & data
Figure 1. Search interface with author browse capability.
Figure 2. Illinois Cancer Center researcher productivity visualization.
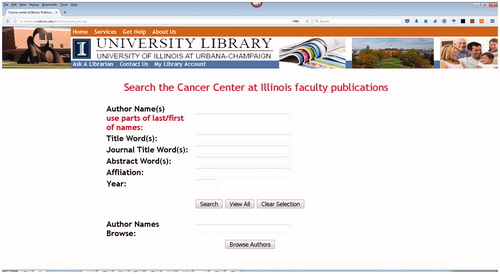
Figure 3. Close-up of the ICC researcher metrics visualization.
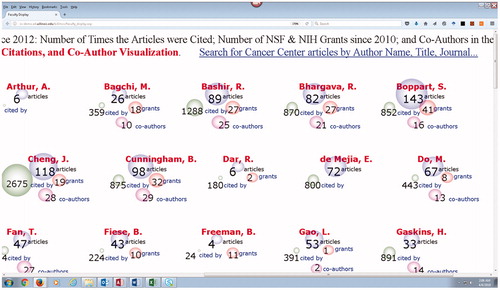
Figure 4. Publication record with links to full-text and citing articles.
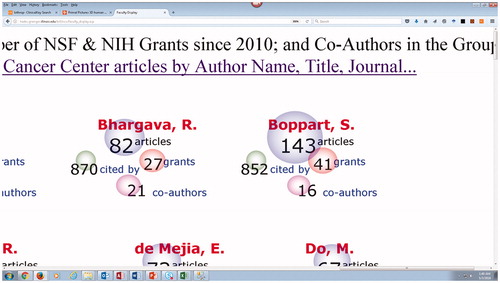
Figure 5. Researcher grants from NSF and NIH.
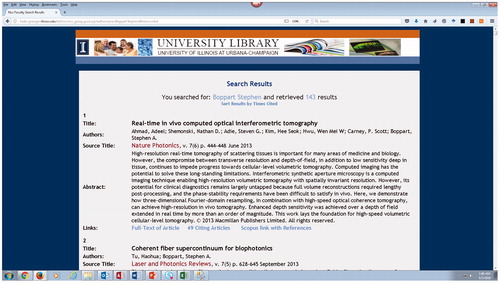
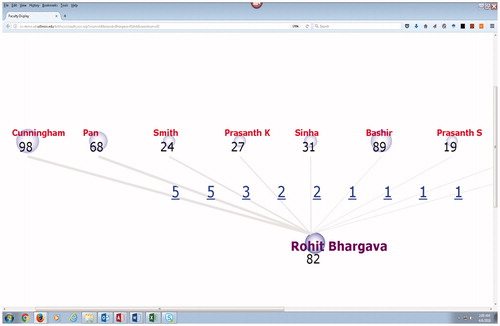
Figure 6. Coauthor display with clickable links to articles.
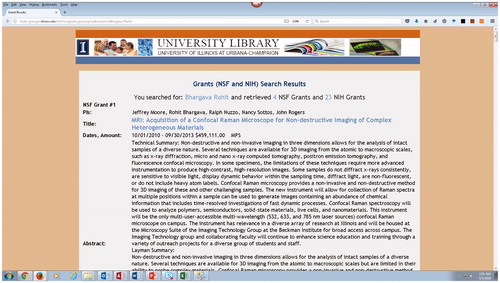
Figure 7. Coauthor display with clickable links to articles.