Figures & data
Figure 1. Monthly average air temperature and total precipitation as well as growing season (April–August) and annual average air temperature and total precipitation and from 2012 to 2019 at the study site.
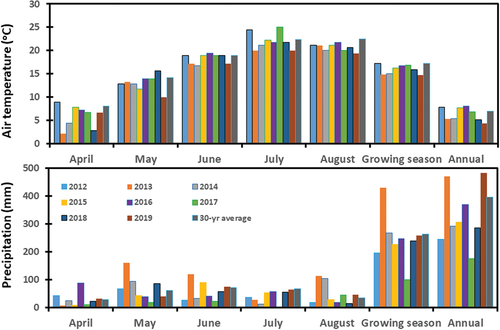
Table 1. Analysis of variance for spring wheat straw N concentration and N uptake, N harvest index (NHI), and grain N concentration, N uptake, N-use efficiency (NUE) and N recovery index (NRI) with sources of variance for cropping sequence (CS), N fertilization rate (NR), and year (YR).
Table 2. Interaction between cropping sequence, N fertilization rate, and year on spring wheat straw N concentration and N uptake, N harvest index (NHI), and grain N recovery index (NRI) averaged across N fertilization rates and cropping sequences.
Table 3. Effect of N fertilization rate on spring wheat straw N concentration and N uptake and N harvest index averaged across cropping sequences and years.
Figure 2. Relationship between N fertilization rate and spring wheat grain N concentration for cropping sequences from 2012 to 2015. Cropping sequences are CTWF, conventional till spring wheat-fallow; NTCW, no-till continuous spring wheat; NTWF, no-till spring wheat-fallow; and NTWP, no-till spring wheat-pea. Markers accompanied by different letters at a N fertilization rate are significantly different at p ≤ 0.05 by the least square means test.
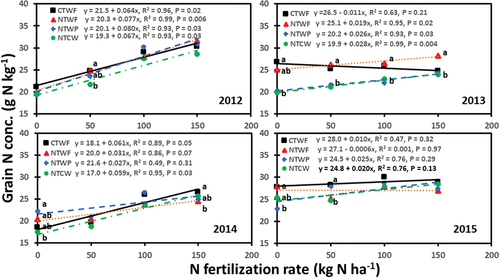
Figure 3. Relationship between N fertilization rate and spring wheat grain N concentration for cropping sequences from 2016 to 2019. Cropping sequences are CTWF, conventional till spring wheat-fallow; NTCW, no-till continuous spring wheat; NTWF, no-till spring wheat-fallow; and NTWP, no-till spring wheat-pea. Markers accompanied by different letters at a N fertilization rate are significantly different at p ≤ 0.05 by the least square means test.
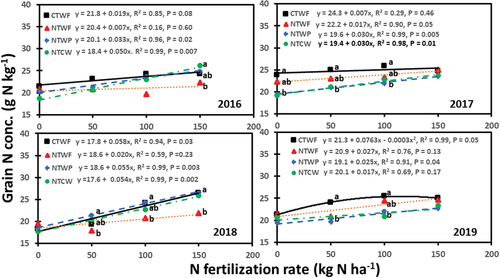
Figure 4. Relationship between N fertilization rate and spring wheat grain (a) N concentration, (b) N uptake, and (c) N-use efficiency (NUE) averaged across years. Cropping sequences are CTWF, conventional till spring wheat-fallow; NTCW, no-till continuous spring wheat; NTWF, no-till spring wheat-fallow; and NTWP, no-till spring wheat-pea. Markers accompanied by different letters at a N fertilization rate are significantly different at p ≤ 0.05 by the least square means test.
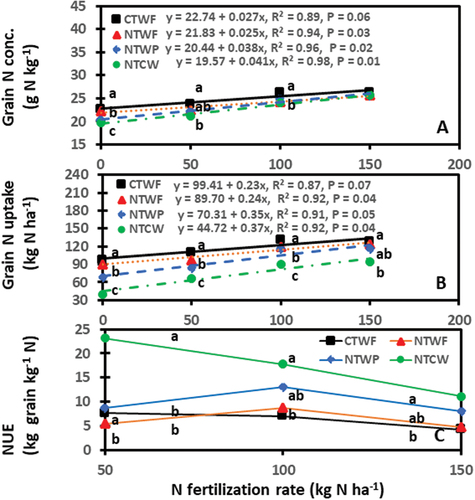
Figure 5. Relationship between N fertilization rate and spring wheat grain N uptake for cropping sequences from 2012 to 2015. Cropping sequences are CTWF, conventional till spring wheat-fallow; NTCW, no-till continuous spring wheat; NTWF, no-till spring wheat-fallow; and NTWP, no-till spring wheat-pea. Markers accompanied by different letters at a N fertilization rate are significantly different at p ≤ 0.05 by the least square means test.
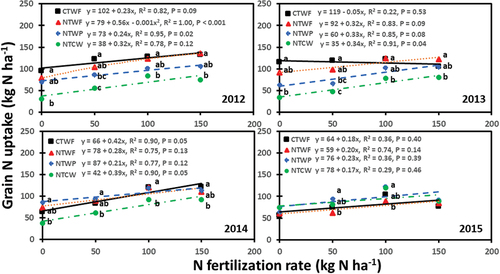
Figure 6. Relationship between N fertilization rate and spring wheat grain N uptake for cropping sequences from 2016 to 2019. Cropping sequences are CTWF, conventional till spring wheat-fallow; NTCW, no-till continuous spring wheat; NTWF, no-till spring wheat-fallow; and NTWP, no-till spring wheat-pea. Markers accompanied by different letters at a N fertilization rate are significantly different at p ≤ 0.05 by the least square means test.
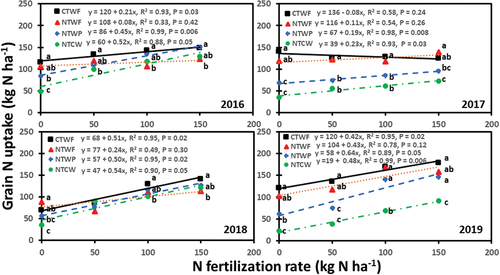
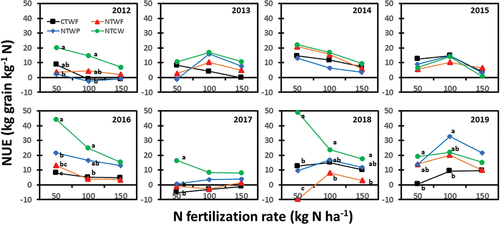
Figure 7. Spring wheat grain N-use efficiency (NUE) as affected by cropping sequence and N fertilization rate from 2012 to 2019. Cropping sequences are CTWF, conventional till spring wheat-fallow; NTCW, no-till continuous spring wheat; NTWF, no-till spring wheat-fallow; and NTWP, no-till spring wheat-pea. Markers accompanied by different letters at a N fertilization rate are significantly different at p ≤ 0.05 by the least square means test.