Figures & data
Figure 1. Example of StockTwits messages.
Note: This figure illustrates web-page of StockTwits Messages in regard to the “Bitcoin” relevant hashtags.
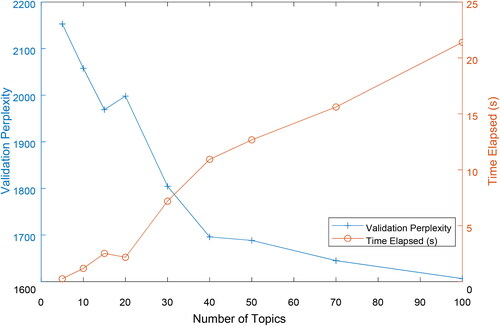
Table 1. News collection summary with annotations.
Table 2. Summary of counting measures.
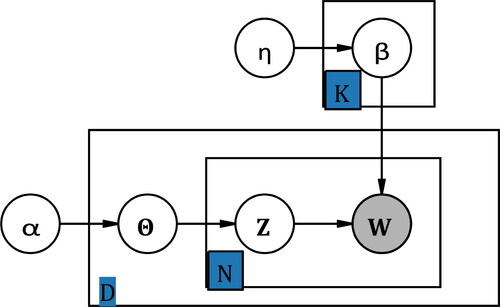
Figure 2. Plate notation for the LDA model.
Note: Plate notation is introduced by Buntine (Citation1994) as a type of structured probabilistic models or probabilistic graphical models, the purpose is to present the human designed conditional dependence structure between random variables. For example, an arrow from variable A to B denotes the hypothetical casualty from A to B. If and only if variables A and B are both inside the same plate or rectangular with a subscript number N is this graph used to simplify the notation that independent two self-distributed variables A and B repeat N times under the condition of causality determined by the arrow’s direction. In other words, there are totally N2 combinations to represent the casualty from A to B.
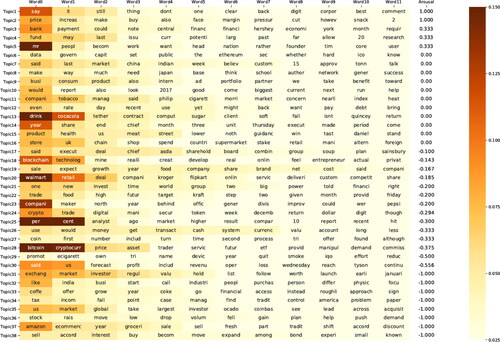
Figure 3. Topic selection for LDA.
Note: We keep 20% of the original data-set for validation. Perplexity is an indicator in information theory that measures how well a probability model predicts a sample. Usually a lower perplexity denotes a higher likelihood that the probability distribution will fit the sample. Time elapsed measures the convergence time of the model, indicating the complexity of the model.
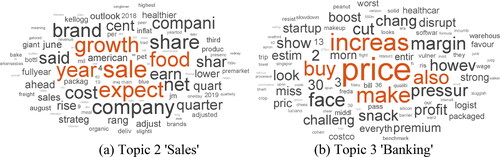
Figure 4. Topics ranked by level of arousal; terms in topics ranked by probability.
Note: This figure presents the 38 individual distributions over N-size dictionary that LDA unsupervised learning algorithm calculates to indicate news topics. To order the detected topics, we create an arousal index by using the average daily highest VIX value as a baseline to calculate the gap in the number of a topic with a daily highest VIX greater or equal to the baseline versus the number of the topic in the opposite case, and divided by the number of the topic in the relevant news collection. In each row, terms are ordered from left to right according to their likelihoods belong to a single topic of their row.

Figure 5. Arousal topics in news narratives.
Note: These word clouds present two relatively high arousal level topics in the Financial Times. The size of words is approximately proportional to the probability belongs to the topic computed by the LDA algorithm.
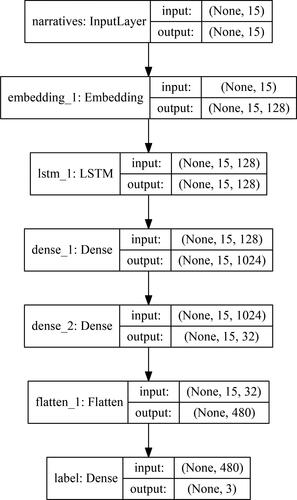
Figure 6. Inactivation topics in news narratives.
Note: The settings of these figures are similar to those presented in , except for the relatively low arousal level topics.
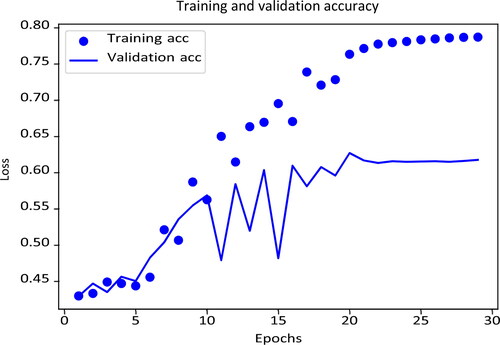
Table 3. Effects of news credibility on market performance.
Table A1. Robustness check for news credibility I.
Table A2. Robustness check for news credibility II.
Table A3. Robustness check for news credibility III.
Figure B1. Neural network framework.
Note: This framework indicates each layer name in our neural network including the shapes of the input and output tensors. The input layer will receive the encoded 1 × 15 text vector and output to the embedding layer. The embedding layer will project each word index scalar in the input vector to a 128-dimension embedding space. The LSTM and dense layers mainly used to approximate the corresponding mapping between text and labels, and the flatten layer corresponds to reshape the high dimension input tensor to a low dimension tensor for the purpose to be operated in the bottom classification layer.
Training and validation accuracy

Figure B2. Deep learning accuracy.
Note: This figure denotes the training and validation accuracy among the iterated K-fold validation with shuffling training process. The horizontal axis indicates the number of a single time the neural network receives the whole training data, called epochs. The vertical axis represents the loss measured by the categorical crossentropy, which is a common loss function in a multi-classification machine learning problem.