Figures & data
Table 1. Expected dividend conditional on #R − #B.
Table 2. Experimental design.
Figure 1. One observer (Pvt) sequential signal sessions; contract prices and fundamental value.
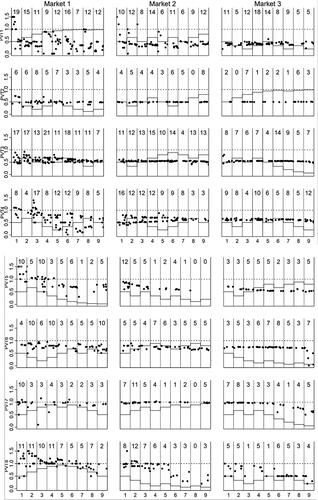
Figure 2. Once observer (Pvt) simultaneous signal sessions; contract prices and fundamental value.
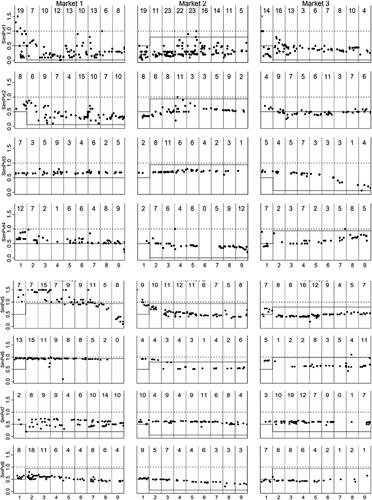
Figure 3. Eight observers (Pub) sequential signal sessions; contract prices and fundamental value.
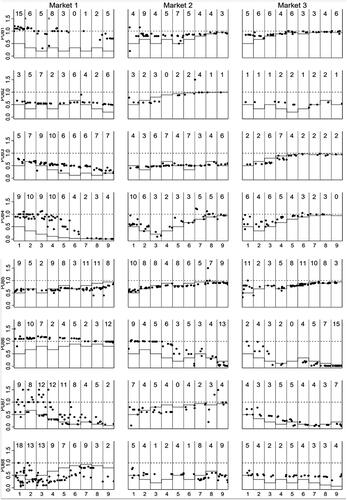
Figure 4. Eight observers (Pub) simultaneous signal observers sessions; contract prices and fundamental value.
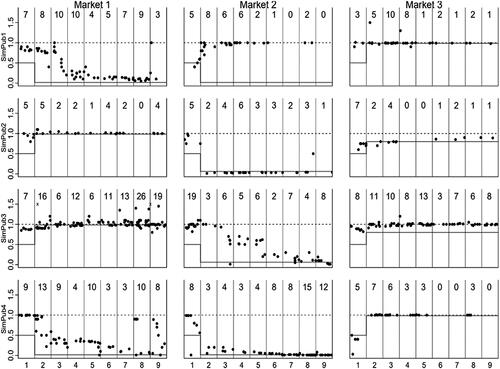
Figure 5. Four observers (4Sig) sequential signal sessions; contract prices and fundamental value.
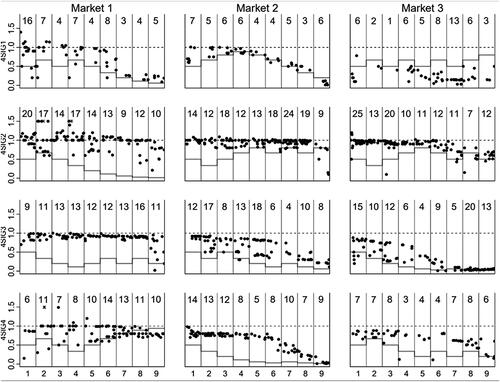
Figure 6. Four observers (4Sig) simultaneous signal sessions; contract prices and fundamental value.
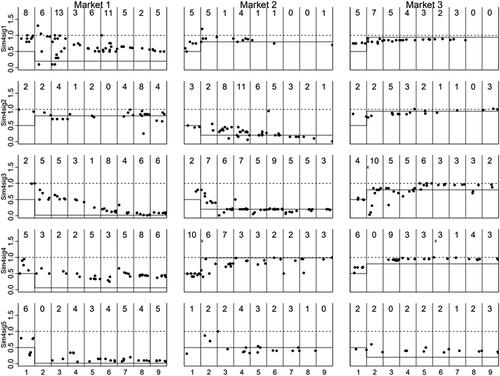
Table 3. Correlations between price and fundamental values.
Table 4. Regression results of the ninth period trading price mean on fundamental value (robust standard errors) for each treatment.
Table 5. Chow tests of homogeneity in treatment pairs: The number of observers and timing treatment effects.
Table 6. Pvt treatment price level regressions (EquationEquation 2(2)
(2) ).
Table 7. Average final asset units holdings conditional upon signal.
Figure 7. Empirical CDF of final asset holdings for Red and Black signal receivers, dashed line for Black.
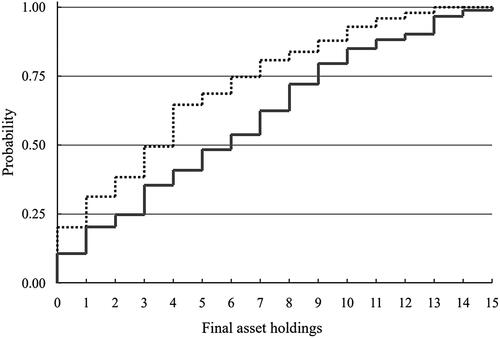
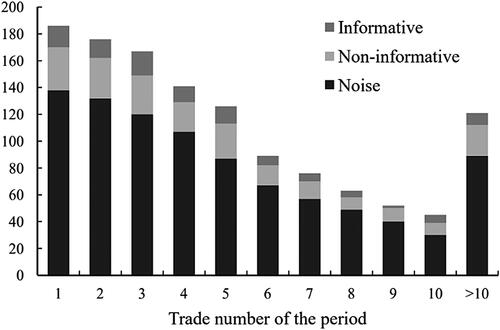
Table 8. Sorting rules of trades into noise, informative, and non-informative classifications.
Figure 8. Count of informative, noninformative, and noise contracts according to trade number in period.