Figures & data
Figure 1. The Shanghai Stock Exchange Composite Index (2005–2021).
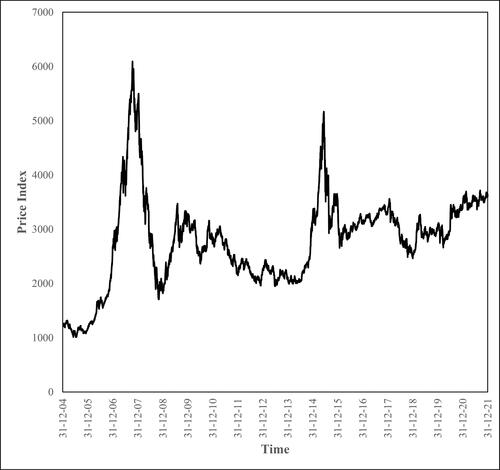
Figure 2. The 2005–2008 Bubble: The Shanghai Stock Exchange Composite Index – an emotional trajectory.
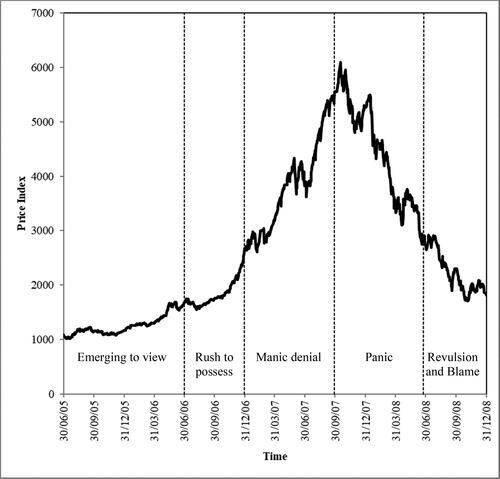
Figure 3. The 2005–2008 Bubble: Shanghai Market Index vs Excitement.
This figure plots the quarterly normalized frequency of excitement words in the Chinese media in percentage terms in columns relative to the pre-bubble period (1.1.2005–30.6.2015) against the Shanghai Stock Exchange Composite Index (SSECI) between 1.7.2005 and 31.12.2008. The horizontal stepped line provides the average of the quarterly normalized frequencies for each of the five stages of the bubble. Correlation between quarterly increase/fall in the SSECI and normalized excitement word frequency = 0.96 (t = 12.6) significant at the 0.01% level.
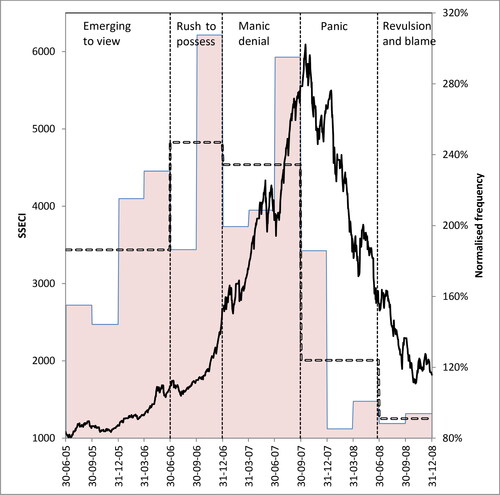
Figure 4. The 2005–2008 Bubble: Shanghai Market Index vs Anxiety.
See for key. Correlation between quarterly increase/fall in the SSECI and normalized anxiety word frequency = −0.48 (t = 1.87) significant at the 10% level.
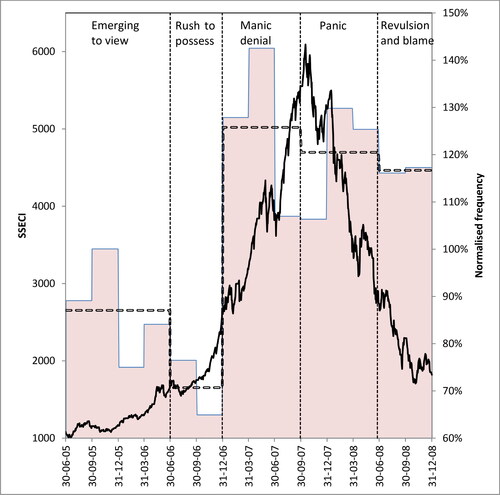
Figure 5. The 2005–2008 Bubble: Shanghai Market Index vs Mania.
See for key. Correlation between quarterly increase/fall in the SSECI and normalized mania word frequency = 0.33 (t = 1.23) not significant at conventional levels.
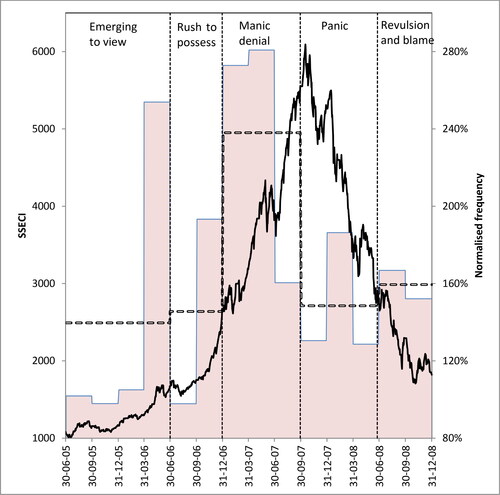
Figure 6. The 2005–2008 Bubble: Shanghai Market Index vs Denial.
See for key. Correlation between quarterly increase/fall in the SSECI and normalized denial word frequency = −0.80 (t = 4.60) significant at the 1% level.
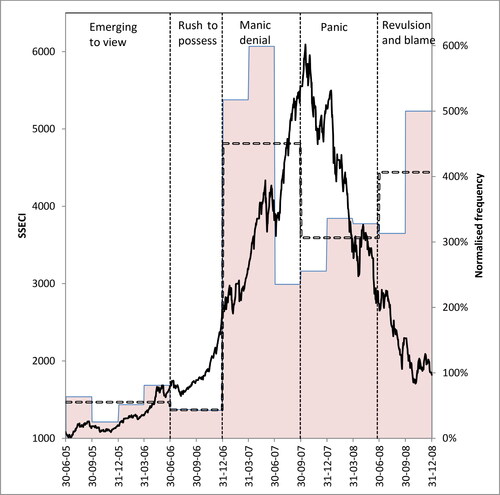
Figure 7. The 2005–2008 Bubble: Shanghai Market Index vs Panic.
See for key. Correlation between quarterly increase/fall in the SSECI and normalized panic word frequency = −0.66 (t = 3.02) significant at the 1% level.
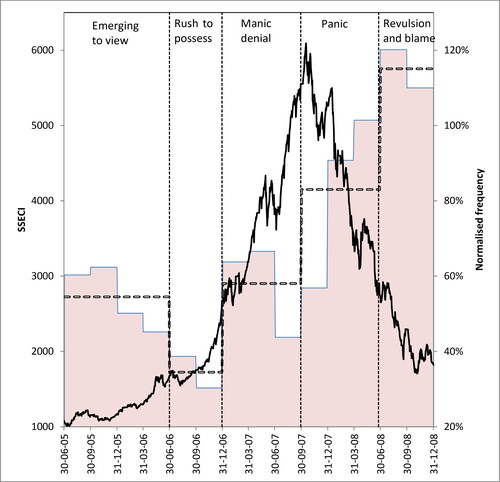
Figure 8. The 2005–2008 Bubble: Shanghai Market Index vs Revulsion and blame.
See for key. Correlation between quarterly increase/fall in the SSECI and normalized revulsion and blame word frequency = −0.76 (t = 4.09) significant at the 1% level.
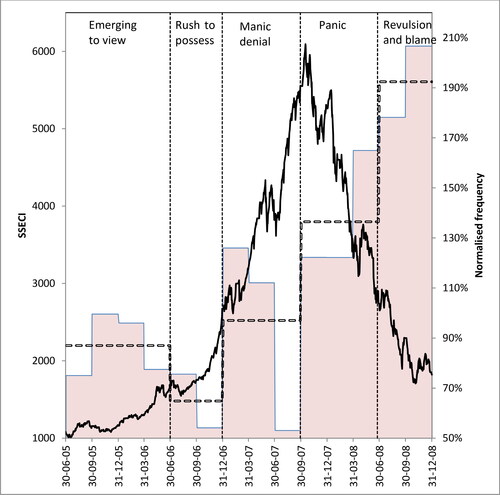
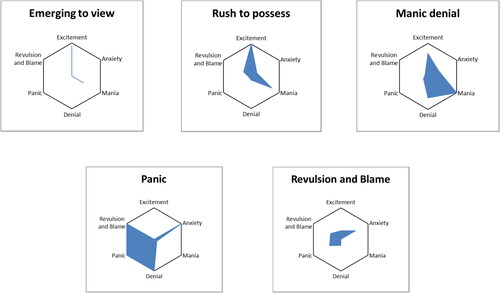
Figure 9. The 2005–2008 Bubble: Data visualization of investor emotions in different market states.
Each glyph plots the six emotions (Excitement, Anxiety, Mania, Denial, Panic, and Revulsion and Blame) in during different stages of the 2005–08 Chinese stock market bubble. Each emotion is scaled between 0 and 1.
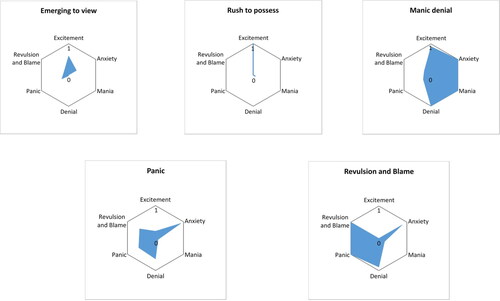
Figure 10. The 2014–2016 Bubble: Shanghai Market Index vs Excitement.
This figure plots the quarterly normalized frequency of excitement words in the Chinese media in percentage terms in columns relative to the pre-bubble period (1.1.2014–30.6.2014) against the Shanghai Stock Exchange Composite Index (SSECI) between 1.7.2014 and 30.06.2016. The horizontal stepped line provides the average of the quarterly normalized frequencies for each of the five stages of the bubble. Correlation between quarterly increase/fall in the SSECI and normalized emotion word frequency = 0.90 (t = 5.2) significant at the 0.01% level.
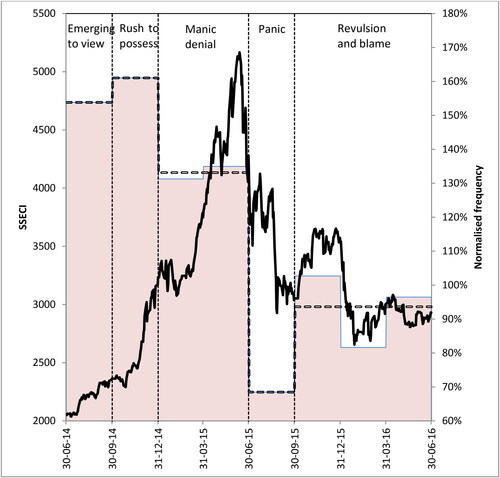
Figure 11. The 2014–2016 Bubble: Shanghai Market Index vs Anxiety.
See for key. Correlation between quarterly increase/fall in the SSECI and normalized anxiety word frequency = −0.87 (t = 4.3) significant at the 1% level.
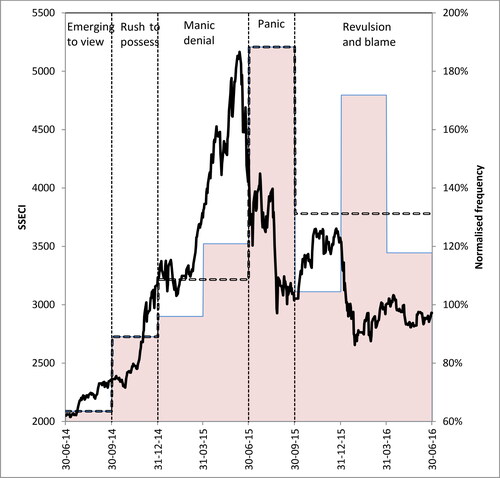
Figure 12. The 2014–2016 Bubble: Data visualization of investor emotions in different market states.
Each glyph plots the six emotions (Excitement, Anxiety, Mania, Denial, Panic, and Revulsion and Blame) during different stages of the 2014–16 Chinese stock market bubble. Each emotion is scaled between 0 and 1.