
Figures & data
Figure 1. Relevant electricity and commercial information flows from the grid user perspective.
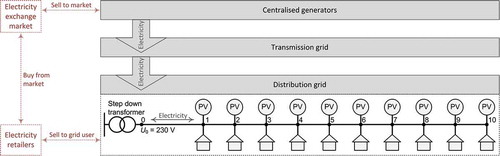
Figure 2. The structure of the proposed energy management: Input/output data and calculation algorithms.
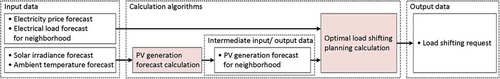
Figure 3. Flowchart of the optimal load shifting planning calculation.
Table 1. Decision table for load shifting request.
Figure 4. Input data: PV plant generation, load, residual load, electricity price.
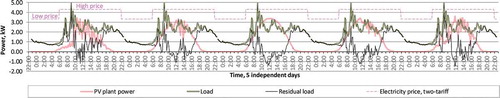
Table 2. Scenarios for flexible load capacities.
Figure 5. First day: Residual load, residual load after performed load shifting by the first grid user (Scenario #4), electricity price, load shifting request for the first grid user (Scenario #4).
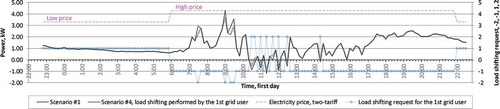
Figure 6. Residual load (scenarios #1 to #5) and electricity price.
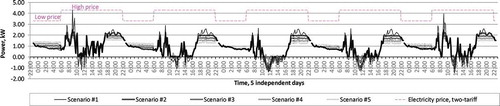
Figure 7. Generation surplus compensation: Scenarios #1 to #5.
Figure 8. Peak load shaving: Scenarios #1 to #5.
Figure 9. Electricity distribution losses per day: Scenarios #1 to #5.
Table 3. Electricity pricing tariffs for grid users.
Figure 10. Average daily electricity costs per grid user at different electricity pricing tariffs: Scenarios #1 to #5.
Figure A.1. Historical data of PV plant: Irradiance on PV panel surface and ambient temperature.
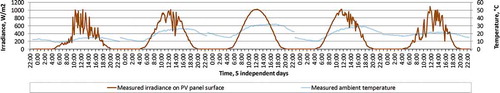
Figure A.2. Historical data of PV plant power output and calculated PV plant power.
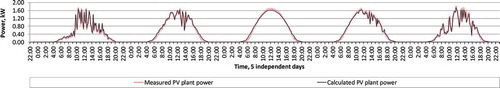
Table B.1. Answer options for questions 1–6.
Figure B.1. Results on questions 1 and 2: Experts’ view on the importance and on the priority of DR system [1 = Not at all important; 5 = Extremely important] [1 = Not priority; 5 = Essential].
![Figure B.1. Results on questions 1 and 2: Experts’ view on the importance and on the priority of DR system [1 = Not at all important; 5 = Extremely important] [1 = Not priority; 5 = Essential].](/cms/asset/a3bbbc3c-1632-4a55-b61f-3230374ca3bb/ljge_a_1355309_f0013_oc.jpg)
Figure B.2. Results on questions 3-5: Experts’ view on the importance of the following DR functions (i) for local electricity grid, (ii) for local generators and (iii) for electricity system support [1 = Not at all important; 5 = Extremely important].
![Figure B.2. Results on questions 3-5: Experts’ view on the importance of the following DR functions (i) for local electricity grid, (ii) for local generators and (iii) for electricity system support [1 = Not at all important; 5 = Extremely important].](/cms/asset/1a56b49d-2eda-4e64-95b6-be74de85f8ac/ljge_a_1355309_f0014_oc.jpg)
Figure B.3. Results on question 6: Experts’ view on the importance of the advanced technical features for different DR systems [1 = Least important; 5 = Most important; 0 as Not applicable].
![Figure B.3. Results on question 6: Experts’ view on the importance of the advanced technical features for different DR systems [1 = Least important; 5 = Most important; 0 as Not applicable].](/cms/asset/46b9d484-0860-44c2-b2f4-bf8a523e2cac/ljge_a_1355309_f0015_oc.jpg)