Figures & data
Table 1. Global oil reserves in %
Table 2. Tariff for electricity pricing in a residential building in KSA
Figure 1. Trends in global electricity generation rate from the year 1950 to 2018 by fuel
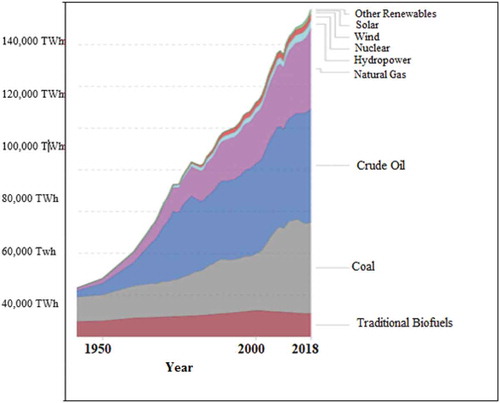
Table 3. The installed capacity of renewable based electricity in the GCC region (MW)
Table 4. A comparison of the cumulative installed solar power capacity in MW for the GCC countries during the period 2010 to 2019
Table 5. Summary of the cumulative installed RE for electric power generation in the GCC countries until the end of 2018 (MW)
Table 6. GCC REpotentials percentage for power production %
Figure 2. The investments in RE projects in G nations during the period 2006–2018
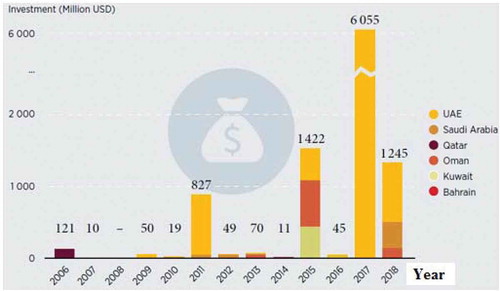
Table 7. Selected energy indicators in the GCC, the Middle East, EU, and the world for 2015
Table 8. Implementation plan
Figure 3. Jobs available in sustainable energy markets
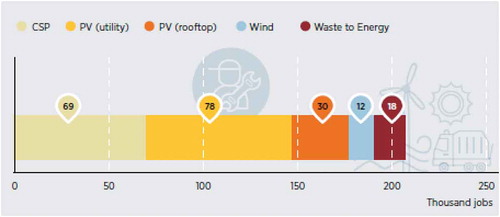
Figure 4. Potential methods for the conservation and management of energy in buildings
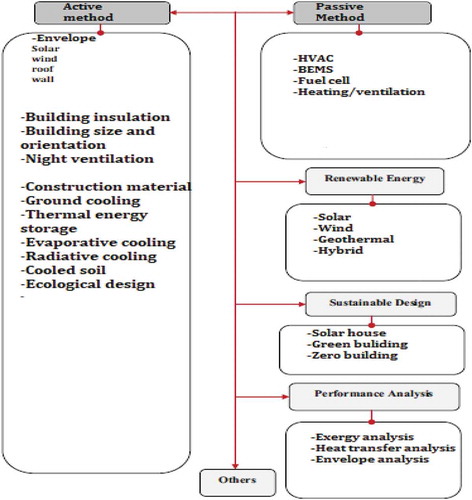
Figure 5. Contributions of electricity in annual energy savings in prototype villas in KSA
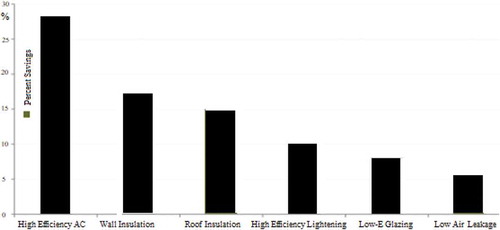
Table 9. Energy efficiency plans in GCC
Figure 6. Global production of electricity via solar PV technology from 2005 to 2015 by region (TWh) 1. Non-OECD Asia excluding china
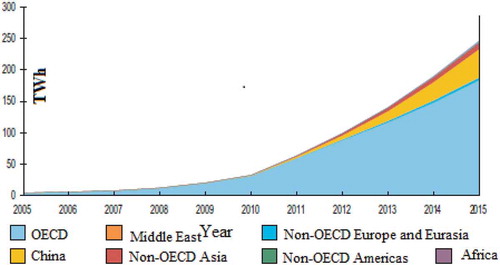
Figure 7. Regional shares of solar PV electricity production in 2005 and 2015
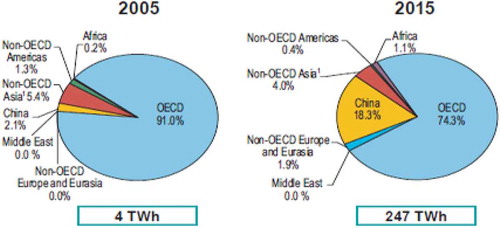
Figure 8. Daily projected electricity production using different technology for UAE in 2030
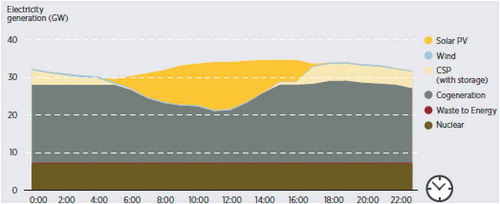
Figure 9. Average annual growth rates of world renewable supply from 1990 to 2015
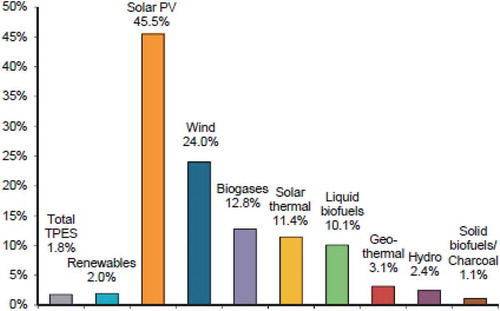
Figure 10. 20 years Net present cost (USD) Vs capacity (MWc)for various solar cooling technologies configurations used in the GCC region
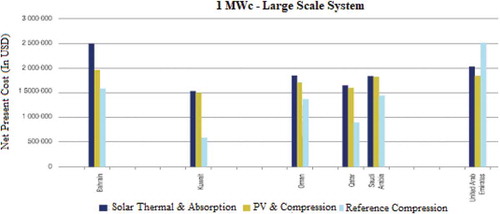
Table 10. Overview of CSP projects in the GCC region
Figure 11. A common solar plant CSP
Table 11. Overview of major PV solar projects in GCC countries
Table 12. Overview of various projects using RETScreen in the GCC region
Figure 12. Total electrical energy injected in grid Vs total radiation received
Table 13. Factors influencing the effect of accumulated dust on the efficiency of the solar collector or solar cell
Table 14. Summary of various works related to dust accumulation in GCC countries
Figure 13. World wind energy production from 2005 to 2015 by region (TWh) 1. Non-OECD excluding china
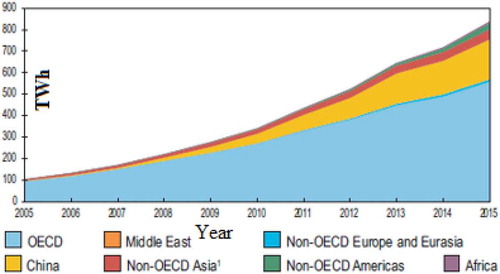
Figure 14. Regional shares of wind electricity production in 2005 and 2015
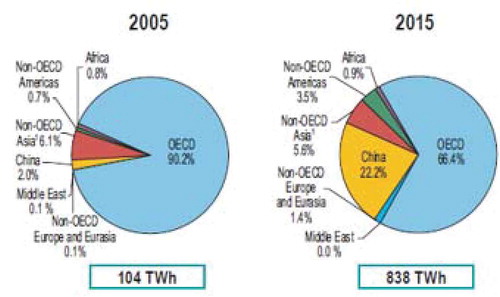
Table 15. Methodology for choosing the site of the wind turbine
Figure 15. Wind power density based on the GIS map at a height of 50 m for the GCC region
Figure 16. Wind speed at a height of 100 m at investigated locations
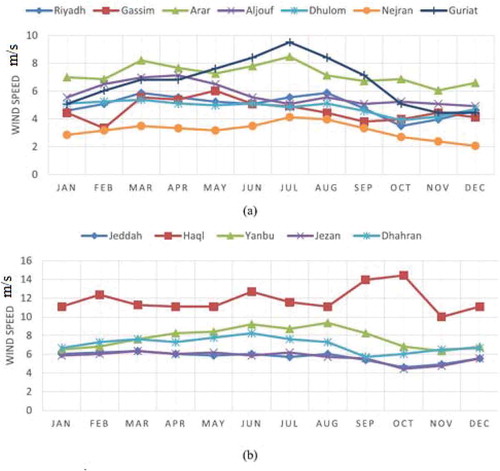
Figure 17. The geographical layout of Harrats in the KSA
Table 16. Resources in the KSA to verify thermal conductivity
Figure 18. The five sites selected for drilling wells by the ministry of petroleum and mineral
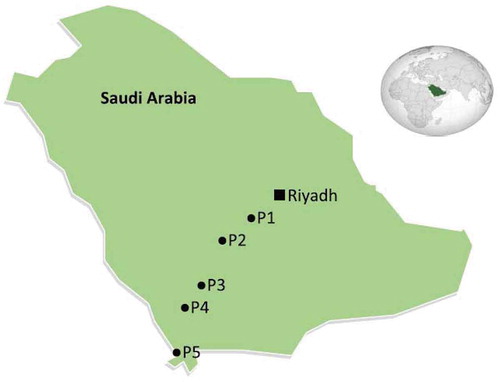
Table 17. Regional distribution of geothermal energy sources
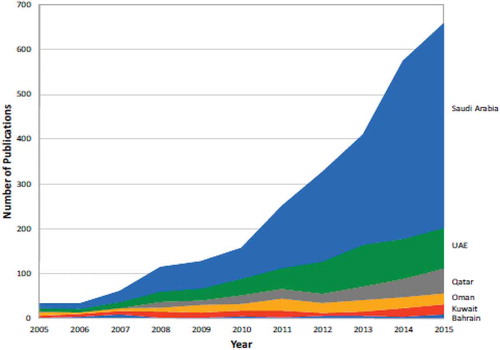
Figure 19. Publication record on solar relate technology