
Figures & data
Figure 1. Characteristic of wind turbines (Ahmed and Gawad Citation2016).
Figure 2. Darrieus types VAWT design concepts (Dabachi, Rahmouni, and Bouksour Citation2020).
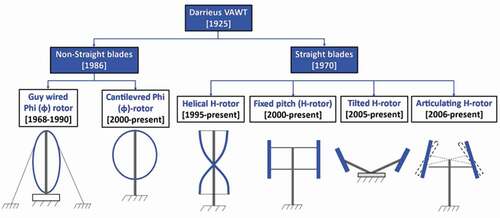
Figure 3. Lift-type VAWTs trends (Möllerström et al. Citation2019).
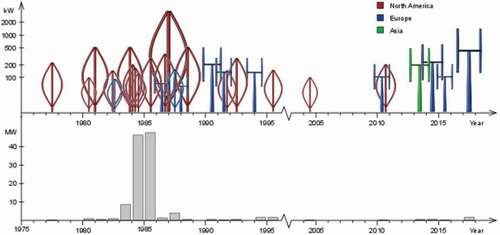
Figure 4. Fixed and variable pitch VAWTs configuration (Sagharichi, Zamani, and Ghasemi Citation2018).
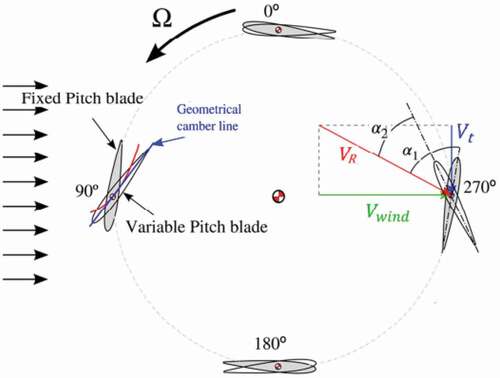
Table 1. Comparison of four different pitching strategies for H-Darrieus VAWT (Zhao et al. Citation2017).
Figure 5. Aerodynamic simulations for the test H-Darrieus rotor operating at λ of 4.5 (Soraghan et al. Citation2013), a) AoA b) Induction Factor c) Tangential Force Coefficient d) Normal Force Coefficient.
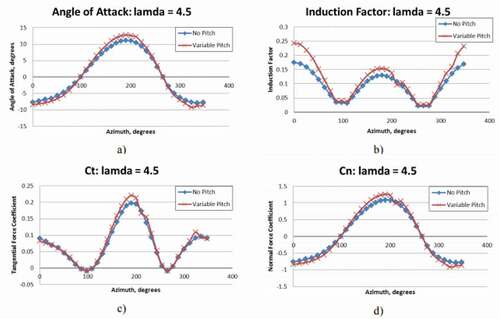
Figure 6. Variation AoA vs azimuthal angle for a λ of 1.5. a) high solidity on the variable pitch (Sagharichi, Zamani, and Ghasemi Citation2018) b) the variation of pitch angle at different azimuth positions vs AoA (Elkhoury, Kiwata, and Aoun Citation2015).
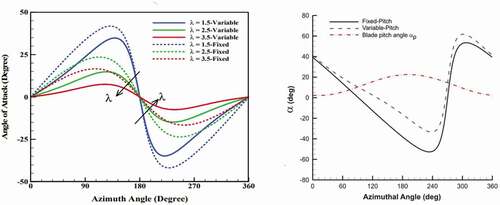
Figure 7. Instantaneous pressure coefficient through mid-plane of an FP and VP angles VAWT at λ = 1 (Elkhoury, Kiwata, and Aoun Citation2015).
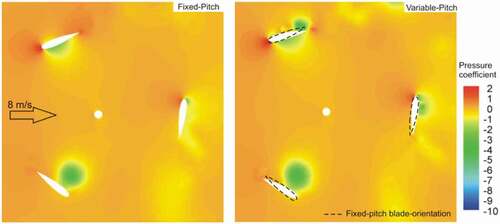
Figure 8. Instantaneous torque coefficients of H-Darrieus VAWT as a function of azimuth position.
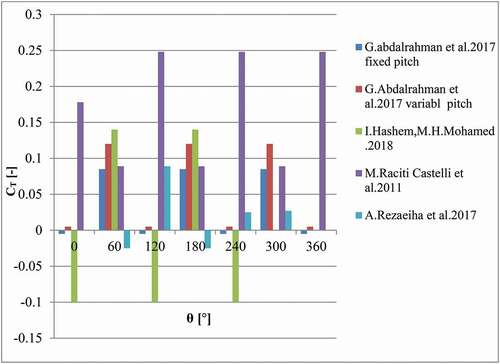
Figure 9. Vortex structure for lower and higher tip speed ratios at different azimuthal positions (θ) (Mukherjee, Jain, and Saha Citation2016).
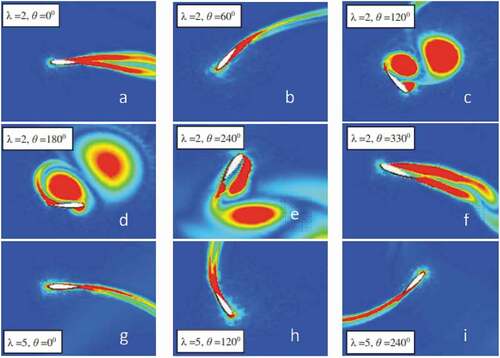
Figure 10. Instantaneous moment coefficient for the last turbine revolution for different tip speed ratios using various azimuthal increments (σ = 0.12) (Rezaeiha, Montazeri, and Blocken Citation2018b).
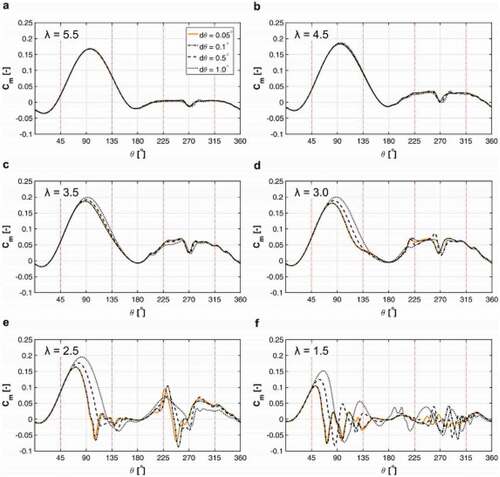
Figure 11. Airfoil performance evaluations, a) instantaneous rotor torque coefficient as a function of the blade at the midsection azimuth coordinate of NACA0012airfoil blade(Castelli et al. Citation2013) b) instantaneous best airfoils torque coefficients different family of an airfoil at 4 tip speed ratio (Mohamed, Ali, and Hafiz Citation2015; Mohamed, Dessoky, and Alqurashi Citation2019).
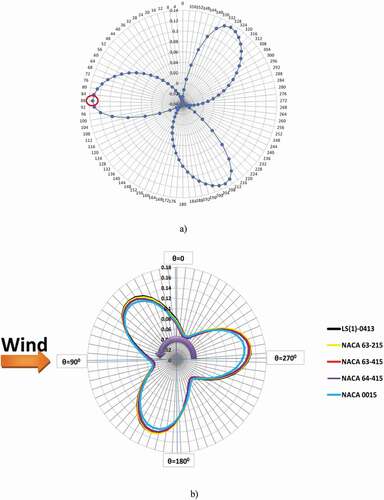
Figure 12. Comparative performance of NACA0015 to four S-series airfoils at different azimuth angles (Cao et al. Citation2018).
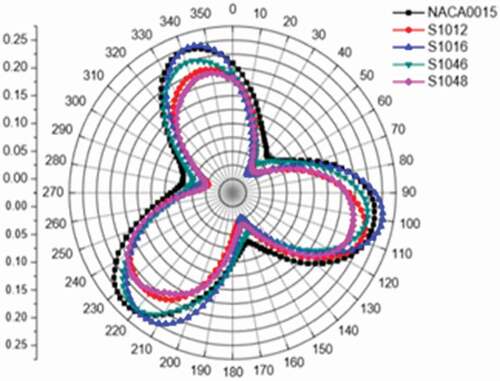
Figure 13. The effect of solidity on Darrieus peak efficiency (Kirke and Lazauskas Citation2011).
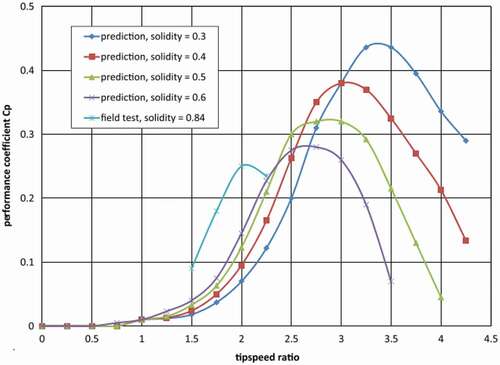
Figure 14. Four bar linkage mechanism in H-Darrieus wind turbine a) 2D view (Kiwata et al. Citation2010), and the 3D view (right) (Sagharichi, Maghrebi, and ArabGolarcheh Citation2016; Sagharichi, Zamani, and Ghasemi Citation2018).
Figure 15. Schematics of the over-speed prevention device using double tail vanes for variable pitch VAWT (Yamada et al. Citation2012).
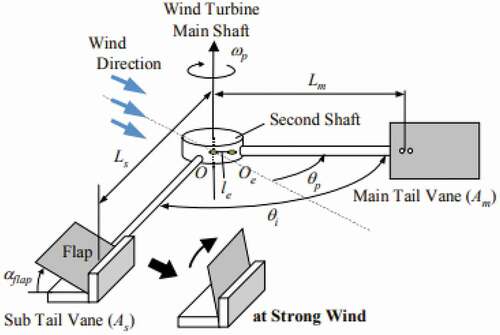
Figure 16. Sensor and actuating systems layout for individual pitch control system (Hwang et al. Citation2006).
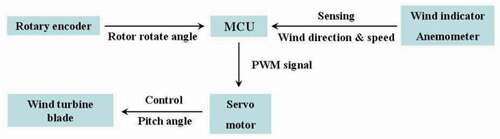
Figure 17. MLP-ANN variable pitch control system (Abdalrahman, Melek, and Lien Citation2017).
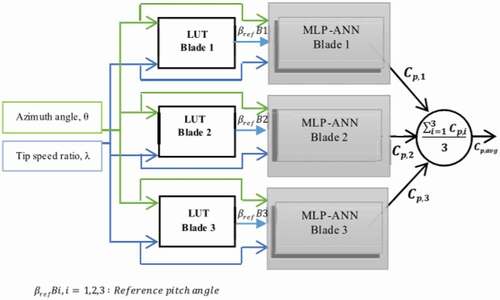
Figure 18. Staggered arrangement of H-Darrieus turbine in a wind farm a) flow domain b) all turbines rotating in the same direction c) One turbine counters rotating.
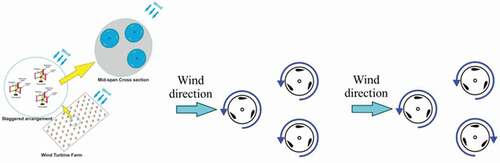
Figure 19. Key elements to be considered during wind turbine blade materials selection (Zangenberg, Brøndsted, and Koefoed Citation2014).
Figure 20. Comparison of the position of natural fibers against synthetic fibers concerning specific tensile strength and stiffness (Ashby Citation2008).
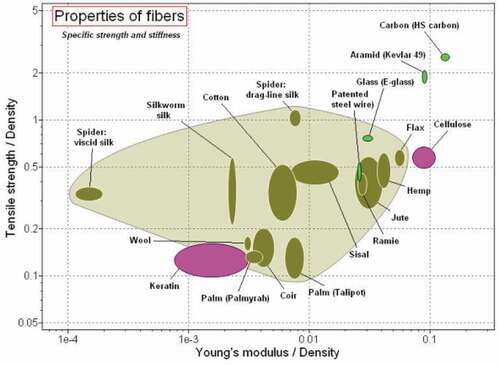
Figure 21. H-Darrieus-Savonieus Hybrid WT performance (Mohamed Citation2013). a) Static torque coefficient and hybrid system. b) Torque coefficients for an individual and hybrid turbine.
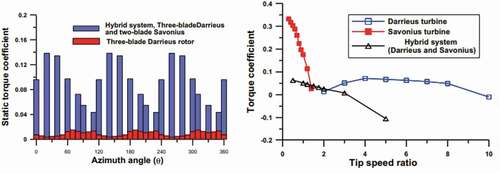
Figure 22. Cascade model of Darrieus VAWT (Kumar et al. Citation2017a).
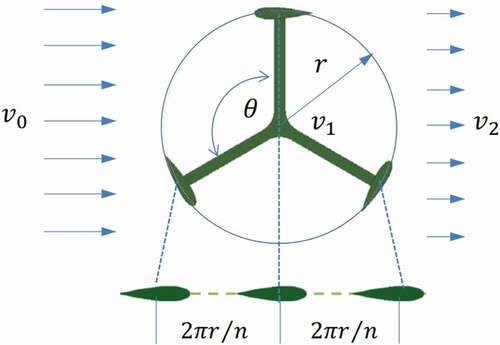
Figure 23. Schematics of vortices model. a) Vortex model filaments in straight-blade (Griffith et al. Citation2018). b) Strength of different vortices of FP and VP H-Darrieus VAWT (Zhao et al. Citation2019).
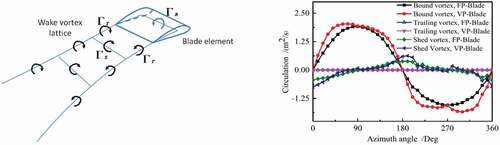
Figure 24. Single-stream tube model (Kumar et al. Citation2017a).
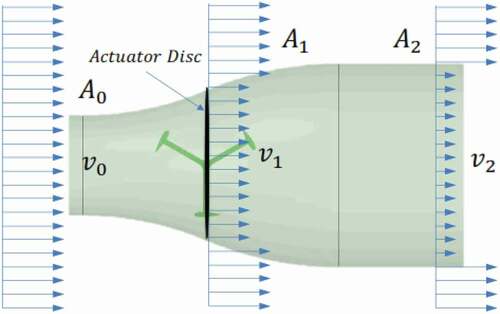
Figure 25. Multiple stream tube model (Kumar et al. Citation2017a).
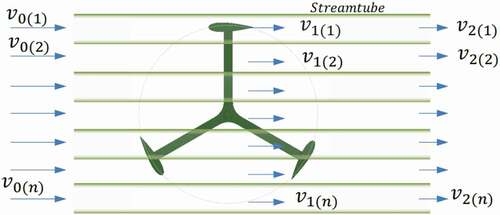
Figure 26. Double multiple stream tube models (Kumar et al. Citation2017a).
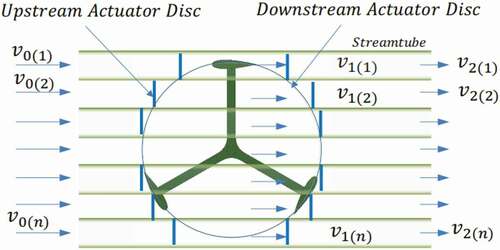
Figure 27. H-Darrieus blade vortex. a) flow streamlines in the tip region, skin friction lines, and z velocity component on the blade suction surface (Balduzzi et al. Citation2017). b) instantaneous torque at different blade sections (Jiang et al. Citation2020).
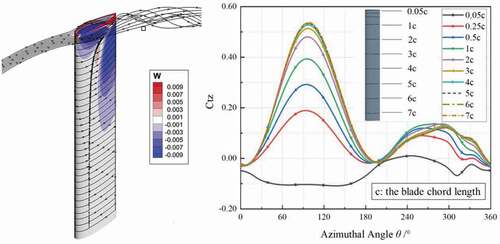
Table 2. Strength and weakness of different analytical models (Batista et al.; Hirsch and Mandal Citation1987; Islam, Ting, and Fartaj Citation2008).
Table 3. Accuracy comparison of aerodynamic models (Ferreira et al. Citation2014).
Figure 28. The flow domain ratio effects on the turbine torque coefficient (Ferreira et al. Citation2014).
Figure 29. CFD model comparison of power coefficient CP as a function of TSR and experimental studies results used for H-Darrieus VAWT.
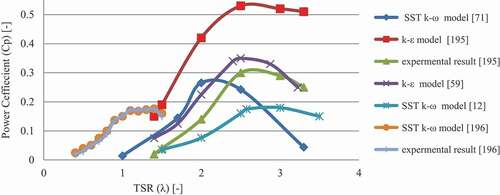
Figure 30. Structural analysis platform of vertical axis wind turbines (VAWTs) (Lin, Xu, and Xia Citation2019).
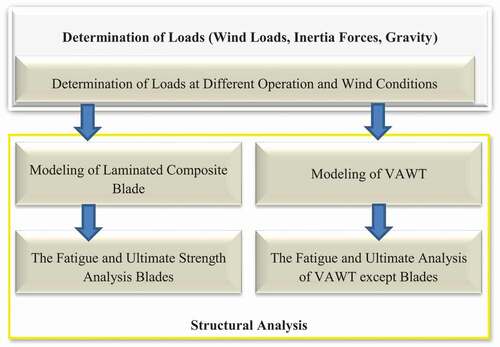
Figure 31. Modal analysis of straight-bladed H-Darrieus WT. a) blade deflection b) natural frequency.
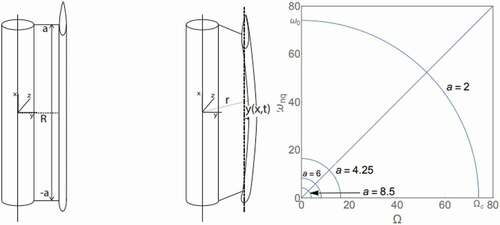
Figure 32. Multi-body dynamics of typical VAWT (Verkinderen and Imam Citation2015). a) FE model of 15 m mast and first three mode shapes. b) Mast, turbine and coupled system natural frequencies for different mast lengths.
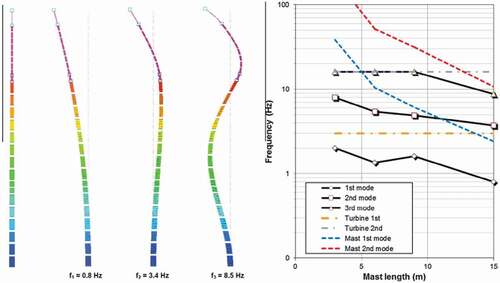
Figure 33. The architecture of ANN (Teksin, Azginoglu, and Akansu Citation2022).
Figure 34. Typical Aeroelastic (FSI) based tool.
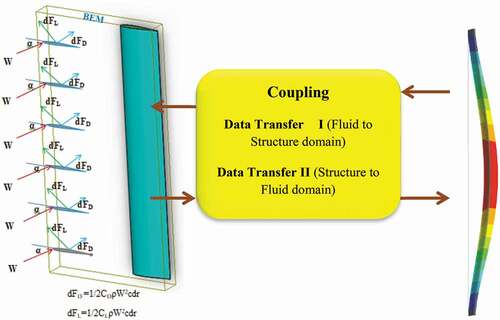
Figure 35. Typical System coupling. a) one-way coupling (Wang et al. Citation2015) (the left side one) b) Two-way coupling (Rafiee, Tahani, and Moradi Citation2016), (the right side one).
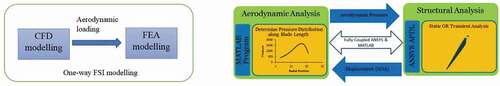
Figure 36. Boundary conditions and computational domain. a) top view b) isometric view.
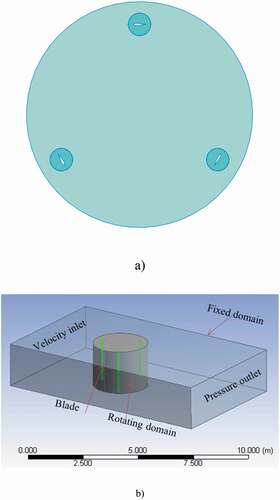
Table 4. Simulation Parameter.
Figure 37. Model mesh.
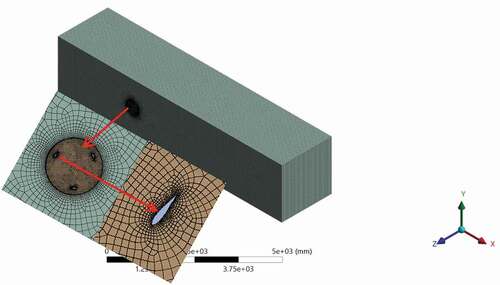
Figure 38. Model grid Independence.
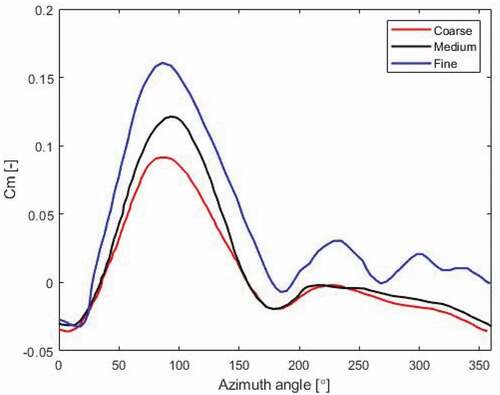
Figure 39. Torque generated in FSI simulation.
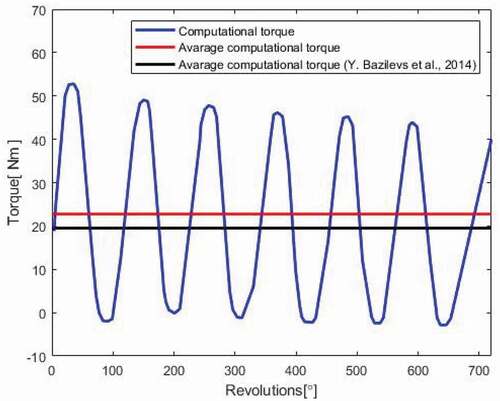
Figure 40. Aerodynamic model comparisons.
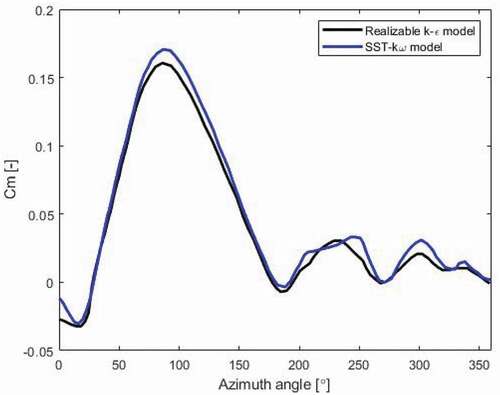
Figure 41. Total deformation contour. a) Epoxy_Eglass _UD blades b) Aluminum Alloy blades.
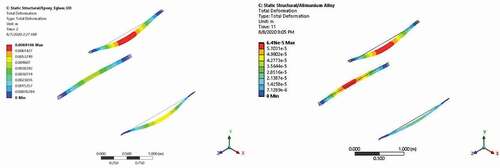
Table 5. Parametric studies of H-Darrieus wind turbine Summary