
Figures & data
Figure 1. Testing setup for hip strength assessment using frame-stabilized dynamometer system device. a − 0° hip angle abduction. b − 0° hip angle adduction. c − 45° hip angle abduction. d − 45° hip angle adduction.
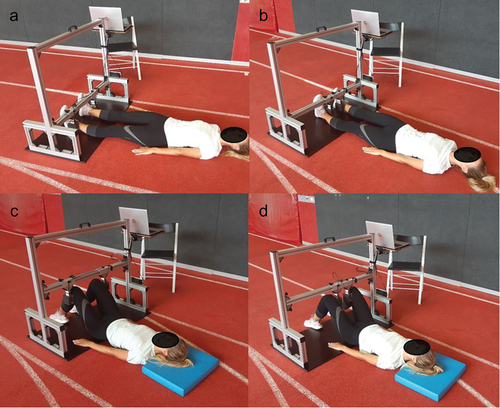
Table 1. Descriptive statistics and agreement between testing positions.
Table 2. Percentiles for maximal isometric adduction and abduction strength and abduction to adduction strength ratio.
Table 3. Receiver operating statistics for distinguishing between women football players with and without previous groin pain.