Figures & data
Figure 1. Experimental setup.
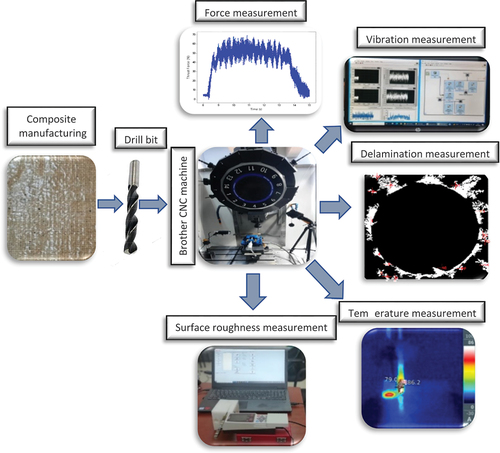
Figure 2. Jute composite plates fabrication process.
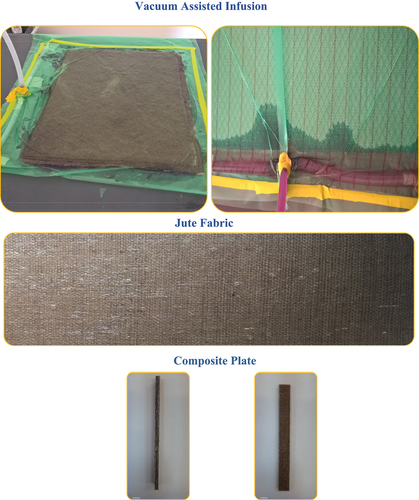
Table 1. Drilling parameters.
Table 2. Technical characteristics of the accelerometer used in the experiment.
Figure 3. Delamination factor calculation.
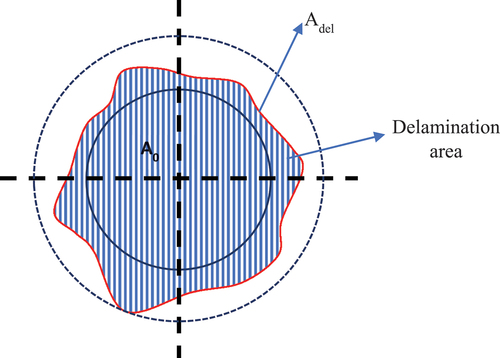
Table 3. Drilling test results.
Figure 4. Thrust force diagram in drilling.
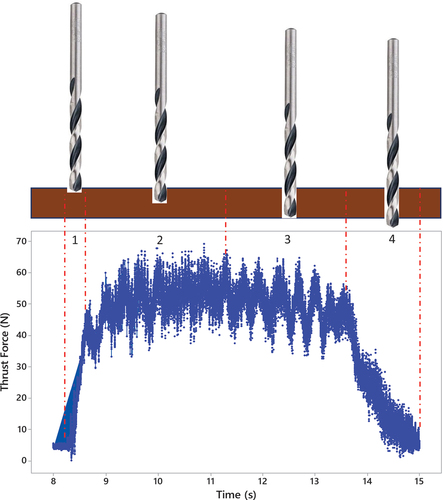
Figure 5. Change in thrust force with respect to feed and revolution.
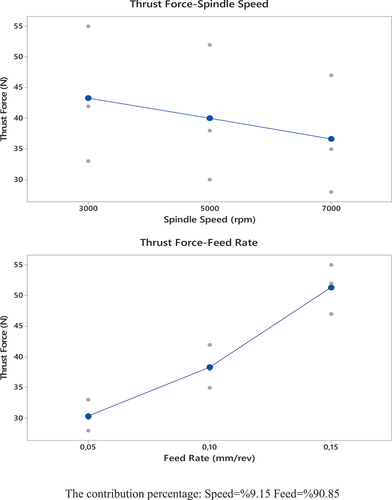
Figure 6. Thrust force distribution graph.
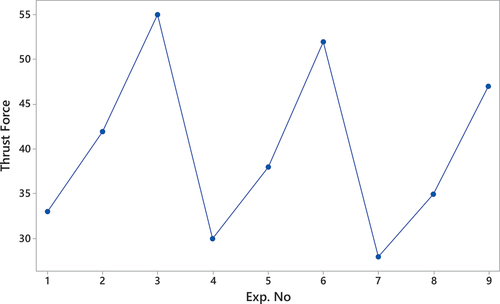
Table 4. ANOVA results of the thrust force.
Figure 7. Variation in vibration with feed and speed.
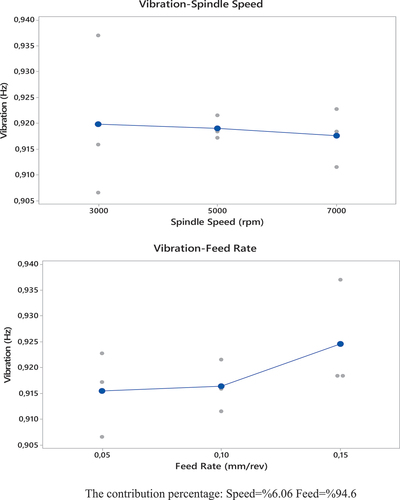
Table 5. ANOVA results of vibration.
Figure 8. Effect of feed and speed on surface roughness.
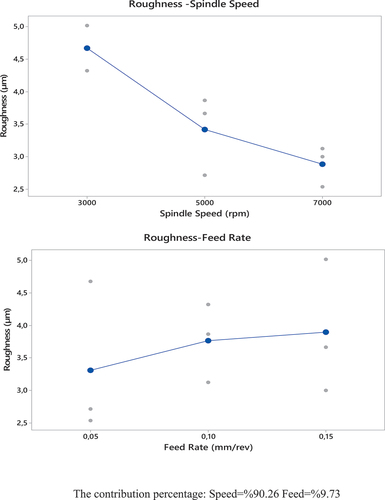
Table 6. Drilling parameters-Roughness ANOVA results.
Figure 9. Effect of feed and speed on temperature.
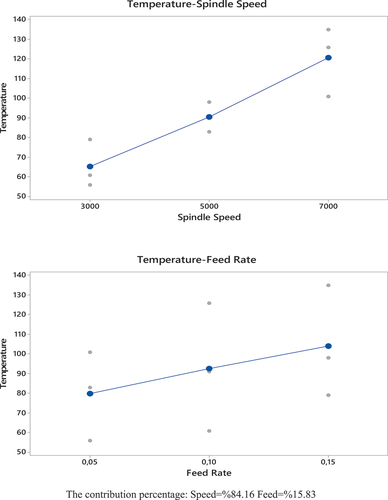
Table 7. Drilling parameters-Temperature ANOVA results.
Figure 10. Hole inner layers and temperature variation.
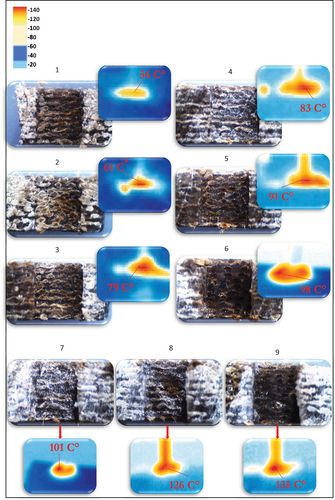
Figure 11. Determination of the delamination area by image processing method.
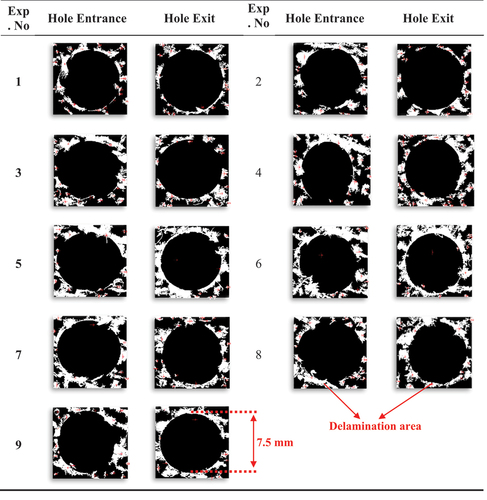
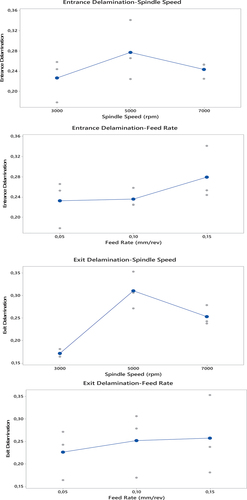
Figure 12. Variation in the delamination coefficient the processing parameters.