Figures & data
Figure 1. Combustion parameters of hemp whole plants material. (a) Heat of combustion over combustion time (HOC). (b) Emission of CO2 (black line) and CO (red line) over combustion time. (c) Heat release rate (HRR) (black line) and Mass loss rate (MLR) (red line) over combustion time. Please note double axes presentation in (a) and (b).
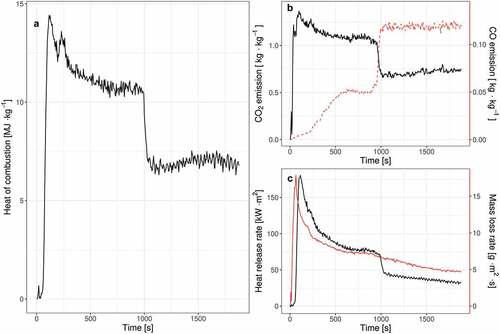
Table 1. Total yield and energy efficiency of whole plants at 18% humidity depending on the amount of sowing and harvest time.
Table 2. Yield and energy efficiency of straw at 18% humidity depending on the amount of sowing and the time of harvest.
Table 3. Yield and energy efficiency of hemp panicles at 18% humidity depending on the sowing amount and harvest date.
Figure 2. Energy efficiency of (a) whole plants, (b) hemp straw, and (c) hemp panicles obtained on three harvest dates: (I) beginning of panicle formation; (II) full flowering; (III) the end of seed setting. Different small case letters (a-c) indicate significant differences between harvest term means according to Fisher’s LSD test (p < .05). Red stars represent the mean values and red vertical lines standard deviations (SD). Dots of different colors represent results obtained from individual plots of different sowing rates as indicated in the legend.
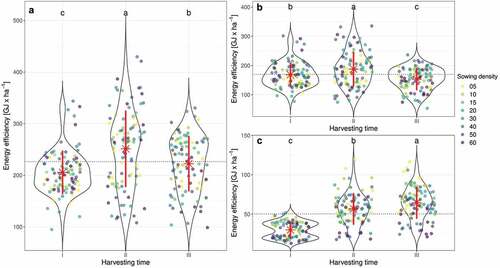
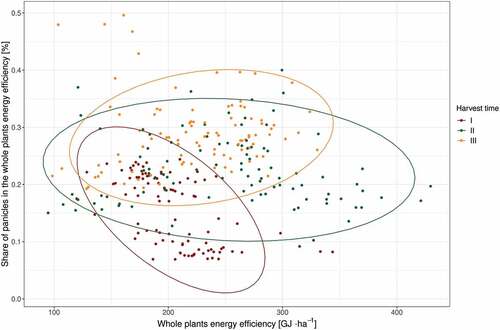
Figure 3. Share of panicles in the total hemp energy efficiency to the whole plants energy efficiency. Ellipses show grouping and dots represent results from individual plots from three harvest dates: (I) beginning of panicle formation; (II) full flowering; and (III) the end of seed setting.