
Figures & data
Table 1. Yarn specification.
Figure 1. Yarn sampling techniques.
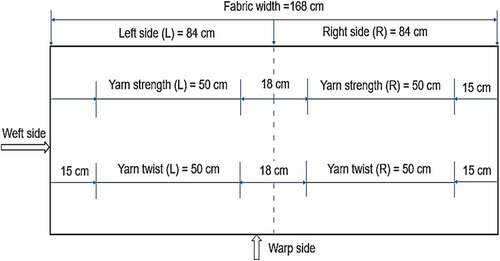
Table 2. Actual levels of factors.
Table 3. Experimental design.
Table 4. Experimental result.
Table 5. ANOVA for weft yarn twist loss.
Table 6. Fit statistics of weft yarn twist loss, tensile and tear strength of fabric.
Figure 2. Actual vs predicted values of twist loss (a), yarn tensile strength loses(b).
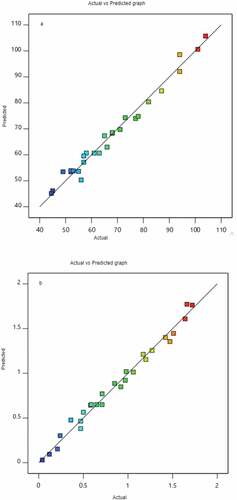
Figure 3. Effect of loom speed (a), Left side relay nozzles pressure (b), Right side relay nozzles pressure (c) and cotton polyester bled ratio (d) on twist loss of the yarn.
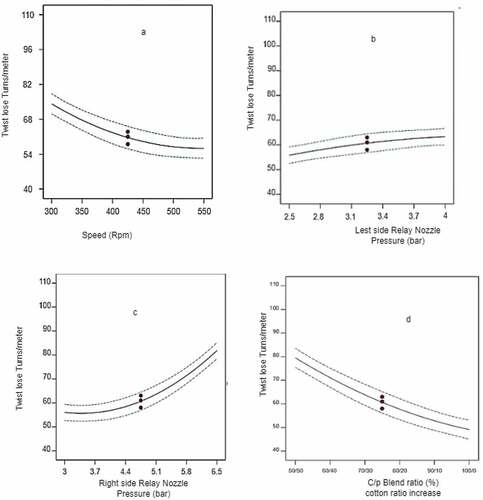
Figure 4. Factor interaction effect on yarn twist loss with a 3D surface graph.
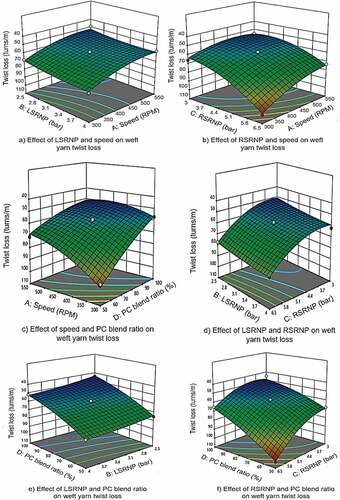
Table 7. ANOVA table for yarn strength loss.
Figure 5. Effect of loom speed (a), Left side relay nozzles pressure (b), Right side relay nozzles pressure (c) and cotton polyester bled ratio (d) on tensile strength loss of the weft yarn.
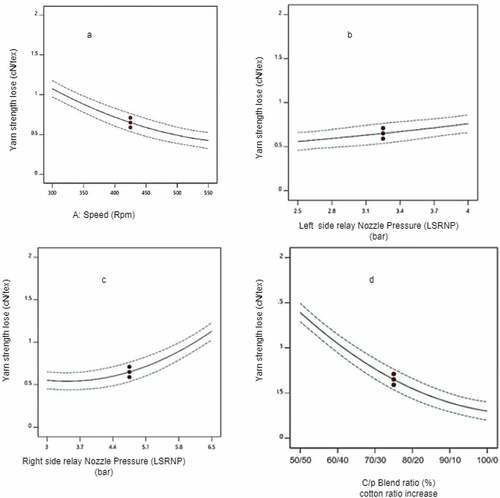
Figure 6. Factor interaction effect on yarn tensile strength loss with a 3D surface graph.
