Figures & data
Figure 1. Numbers of articles published per year from 1975 to 2021 (a) and the polynomial fit of numbers of articles published per year with publication years (b).
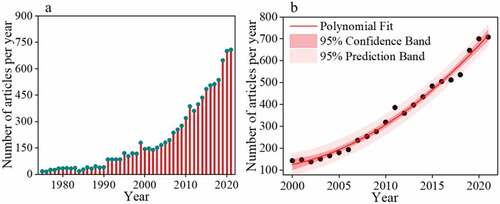
Figure 2. Main contributors to the research of flax in terms of countries (a), affiliations (b), authors (c), research areas (d), Web of Science categories (e), and journals (f).
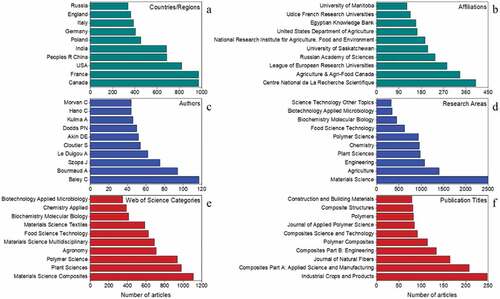
Figure 3. Collaborations between the main countries devoted to flax studies (2000–2022).
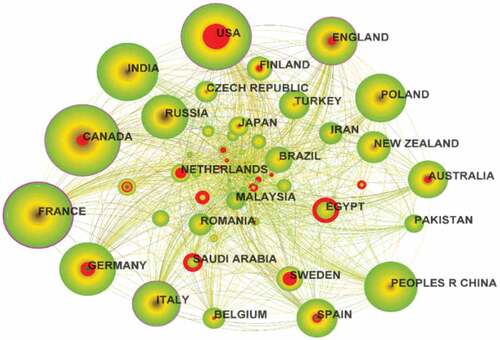
Figure 4. Keyword co-occurring networks and co-citation clusters for articles (2000–2022).
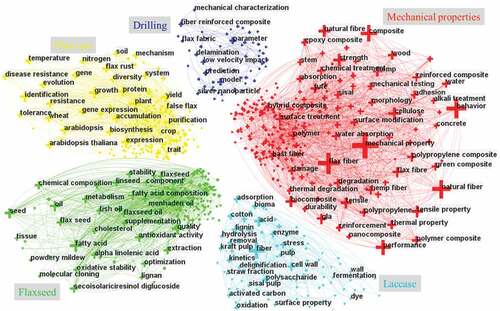
Table 1. Top 20 high-frequency keywords and related references emerging in articles.
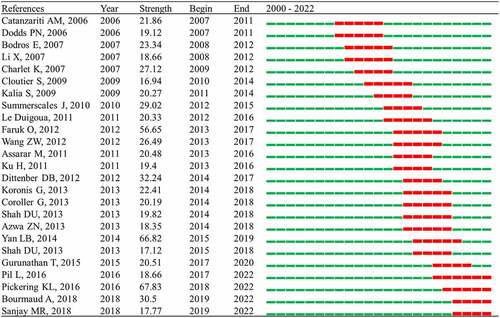
Figure 5. Top 23 keywords with strongest citation bursts.
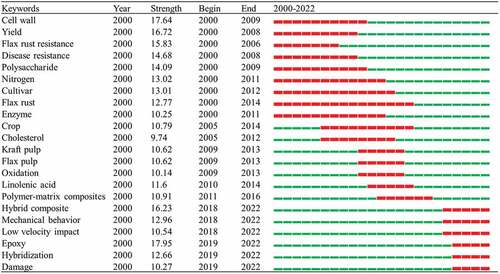
Figure 6. Top 25 cited references with strongest citation bursts.