Figures & data
Figure 1. The phenotype for flax in fast growth period under water logging condition. (a) Phenotype. (b) SPAD. (c) Height. (d) Total biomass for per plant.
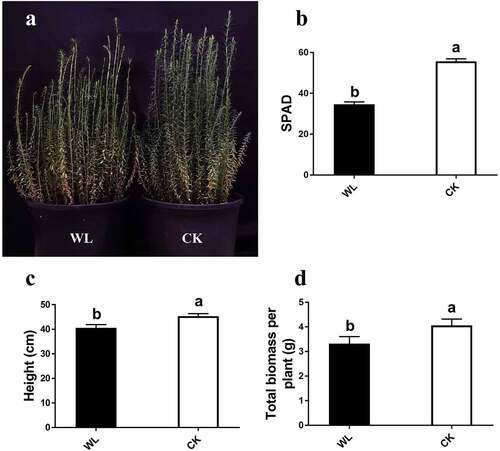
Figure 2. The phenotype for flax in harvest stage under water logging condition. (a) Height and technical length. (b) Forks and diameter. (c) Dry weight for different periods.
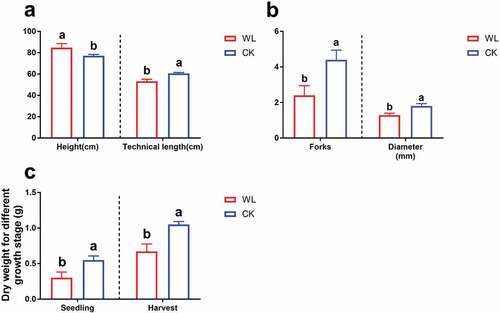
Figure 3. The differences between groups. (a) The number of difference genes in groups. (b) PCA analysis in groups.
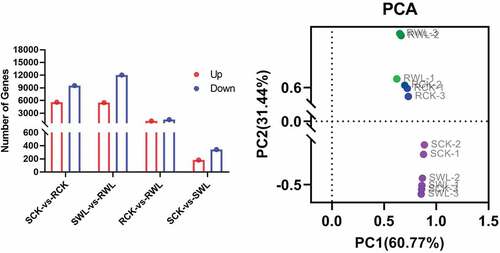
Figure 4. Gene classification based on Gene Ontology (GO) for differentially expressed genes (DEGs) in four types of samples.
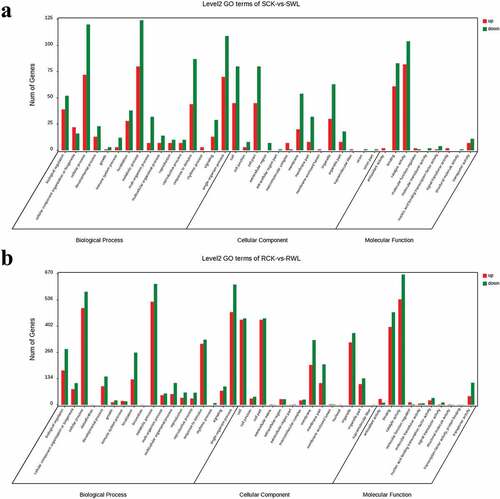
Figure 5. Pathway of flax under water logging condition.
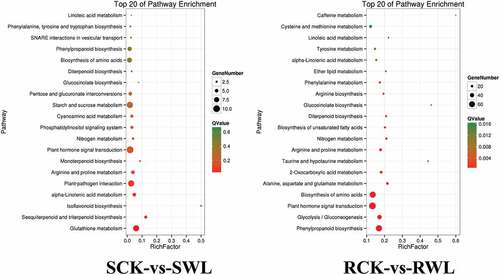
Figure 6. The FPKM of glutathione metabolism (a) and Plant-pathogen interaction (b) in shoot under water-logging conditions.
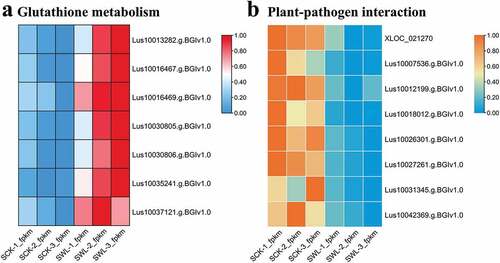
Figure 7. The FPKM of phenylpropanoid biosynthesis in root under water-logging conditions. (a) 21 up-regulated genes. (b) Most significantly up-regulated genes.
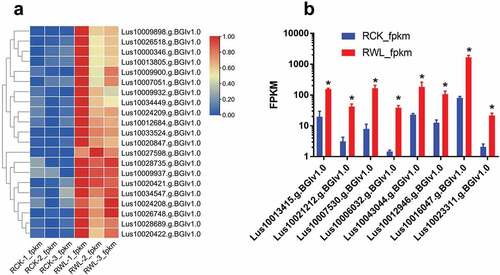
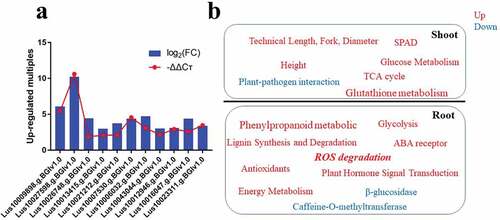
Figure 8. Up-regulated genes and model map. (a) 11 genes’ change fold under water-logging conditions. Transcriptome (blue pillars) and RT-PCR (red line). (b) Model map.