
Figures & data
Figure 1. (a) Luffa cylindrica flower, (b) luffa cylindrica young fruit, (c) matured luffa cylindrica fruit, (d) fibers in the outer shell of the sponge gourd.
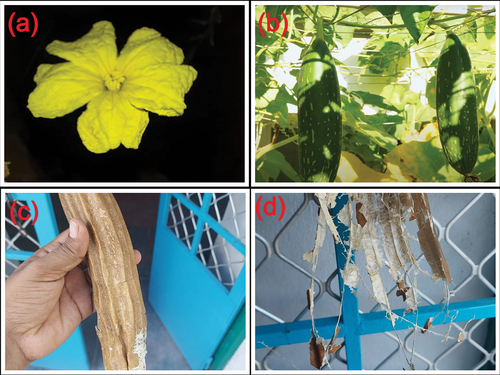
Figure 2. Extracted fibers from the outer shell of the sponge gourd.
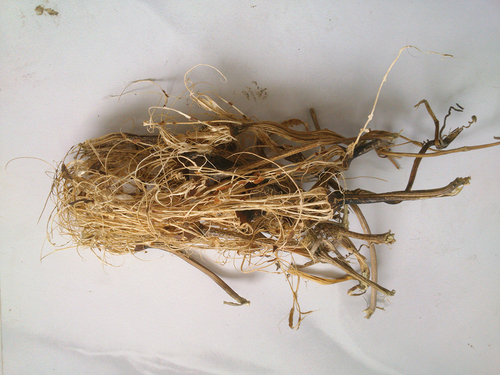
Figure 3. Fiber extraction process flow chart.
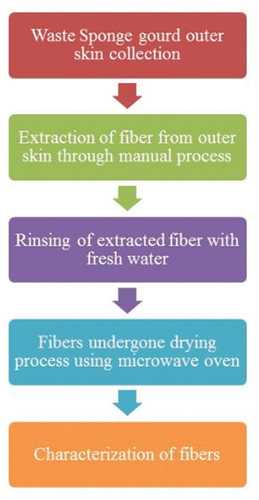
Table 1. SGOSF properties compared with other natural fibers.
Figure 4. XRD analysis of SGOSF.
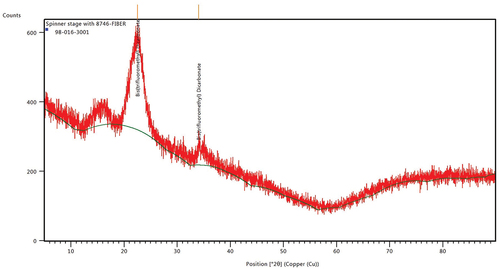
Figure 5. FTIR analysis of SGOSF.
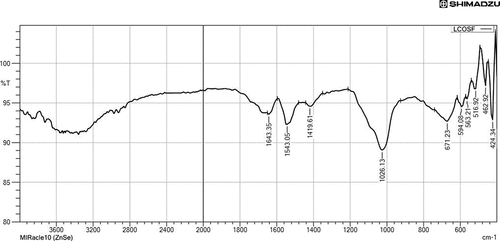
Table 2. Functional groups present in the SGOSF.
Figure 6. Mass loss graph (TGA).
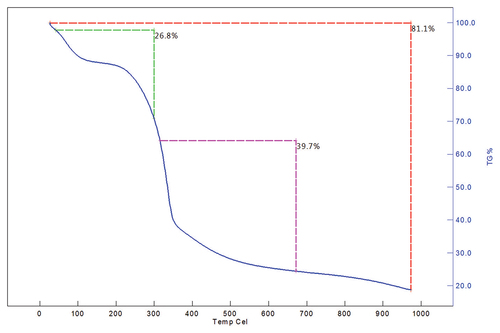
Figure 7. TGA analysis of SGOSF.
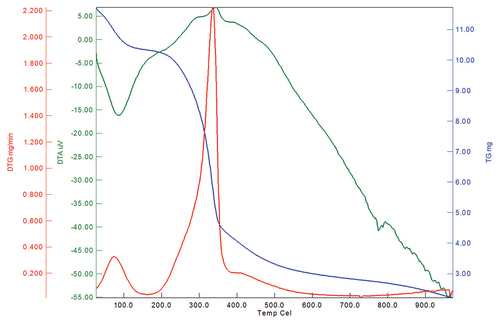
Figure 8. Water absorption behavior of SGOSF.
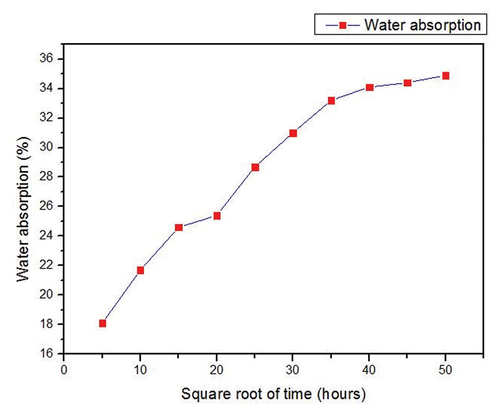
Figure 9. SEM analysis of SGOSF. (a) SEM image with 200 µm size, (b) SEM image with 50 µm size, (c) SEM image with 5 µm size, and (d) SEM image with 500 µm size.
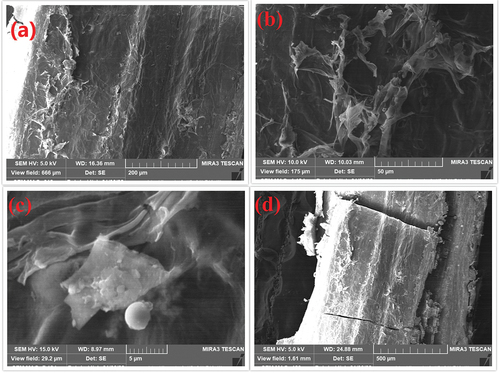
Table 3. Elements present in the surface of SGOSF.