Figures & data
Figure 1. a) a dry flower head of milk thistle with a bulb filled with hairy fibers in the seed bed surrounded by spine-tipped bracts at the base. b) the flower bulbs after removal of the stems and bracts. c) Hairy fibers of the flower bulb.
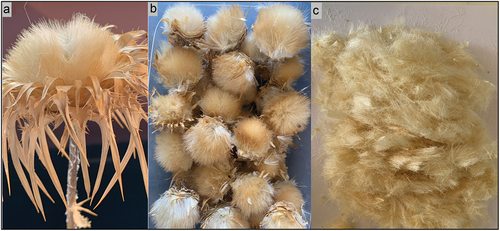
Figure 2. FTIR spectrum of the fibers obtained from the flower heads of milk thistle showing the % transmittance vs. wavenumber in cm−1. Identified peaks are numbered 1 through 11.
Table 1. The FTIR-obtained absorption band wavenumbers (cm−1), with the assigned functional groups and fiber components.
Figure 3. The XRD pattern of the raw fibers obtained from the flower heads of milk thistle. The peak at 2θ 15.74°Corresponds to the amorphous constituents of the fibers, whereas the 2θ peak at 22.49°Corresponds to the crystalline content of cellulose in the fiber. I002 is the intensity of the 002-lattice diffraction peak corresponding to cellulose and Iam is the peak intensity of the amorphous part of the sample.
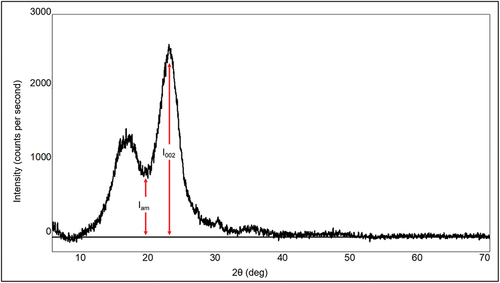
Figure 4. TGA plot (represented by a solid line) and DTG curve (represented by a dashed line). Three main stages were detected: The maximum mass loss due to dehydration occurred at 60°C, the maximum mass loss due to degradation of hemicellulose took place at 274°C, and the maximum mass loss attributed to the degradation of cellulose occurred at 340°C.
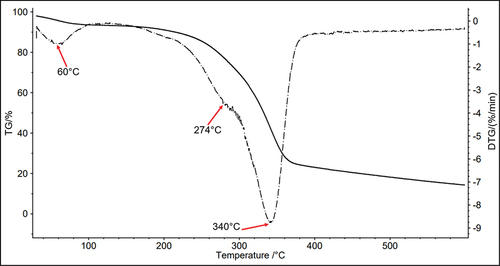
Table 2. The mass percentages of fiber constituents obtained via neutral detergent solution, acid detergent solution, and acid detergent lignin analyses. Values from three experiments, averages and standard deviations are provided.
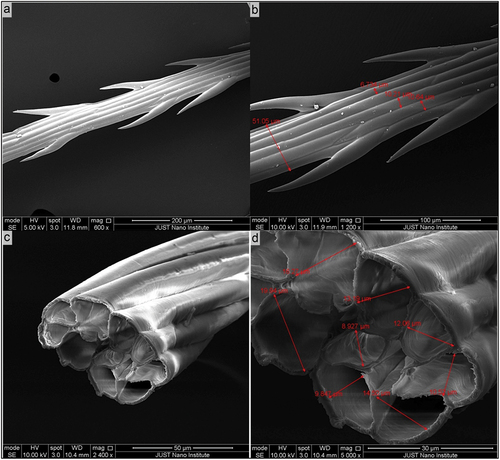
Figure 5. SEM images of a single raw fiber obtained from the flower heads of milk thistle. a) a single fiber outer surface at a magnification of 600× showing the longitudinal grooves on the outer surface and the thorny structures on the sides of the fiber. b) a single fiber outer surface at a magnification of 1200× showing impurities on the surface in addition to the longitudinal grooves on the outer surface and the thorny structures on the sides of the fiber. c) a cross-sectional view of a cryo-fractured fiber at a magnification of 2400× showing the hollow lumens interconnected by cell walls. d) a greater magnification of the hollow lumens, 5000×, showing the irregular polygonal internal lumen shapes.