Figures & data
Table 1. Assessment of the resistance of flax varieties of oilseeds to lodging and shedding, points.
Figure 1. Seeds character. (a) Weight of 1000 seeds. (b) Field germination of seeds.
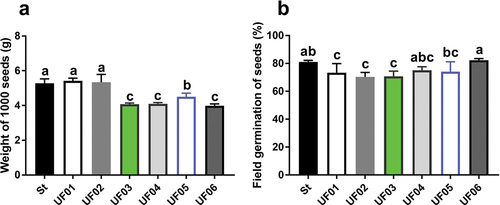
Figure 2. Field growth performance in 2019 and 2020. (a) Dynamics of plant height in 2019. (b) Dynamics of plant height in 2020. (c) Growing season in 2019 and 2020.
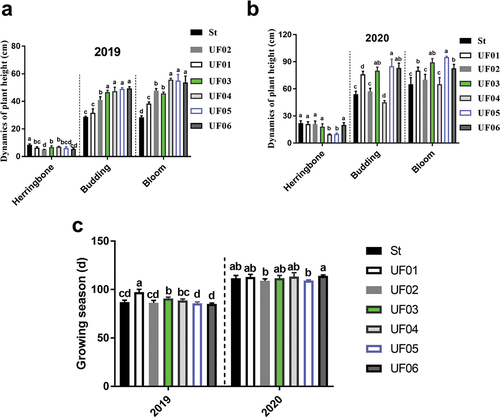
Figure 3. Growth situation for different verities in 2020. (a) Biomass accumulation in growth period. (b) Photosynthetic potential. (c) Net productivity of photosynthesis.
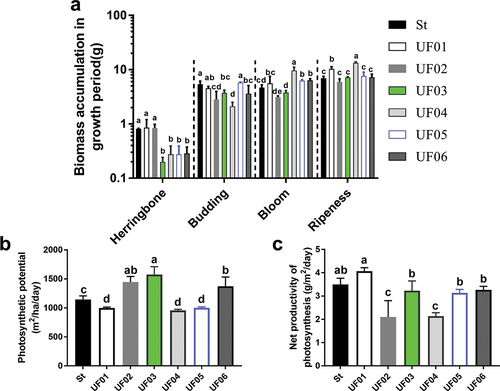
Figure 4. Field yield for per plant. (a) Pods number for per plant. (b) Grain weight for per plant.
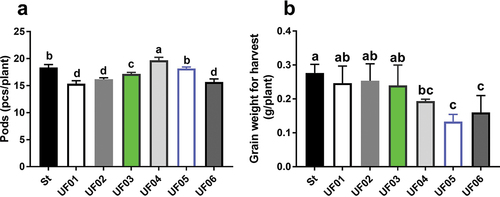
Figure 5. Field yield for field. (a) Seeds number for harvest (pcs/plant). (b) Plants number for harvested. (c) Yield (c/ha). (d) Preservation for harvesting (%).
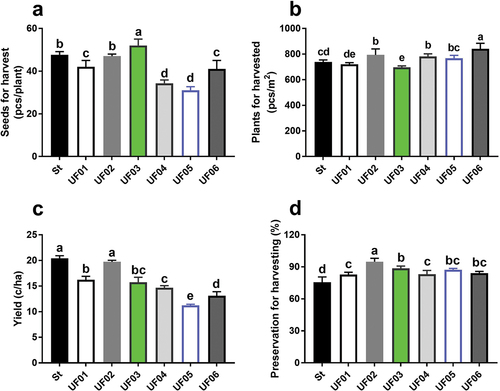
Figure 6. The nutrition composition for grains. (a) Weight of 1000 grains. (b) the content for crude fat. (c) the content for fat by acid hydrolyzation. (d) the content for fat by Soxhlet. (e) Iodine number. (f) the content for Protein.
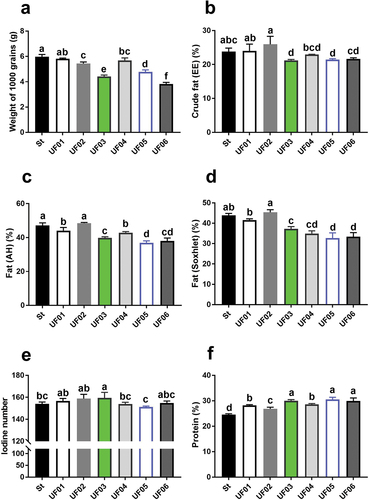
Figure 7. The content for oil. (a) the content for Linolenic acid. (b) the content for Linoleic acid. (c) the content for Oleic acid. (d) the content for palmitic and stearic acid.
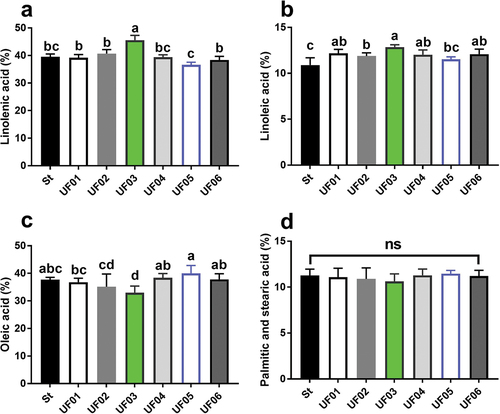
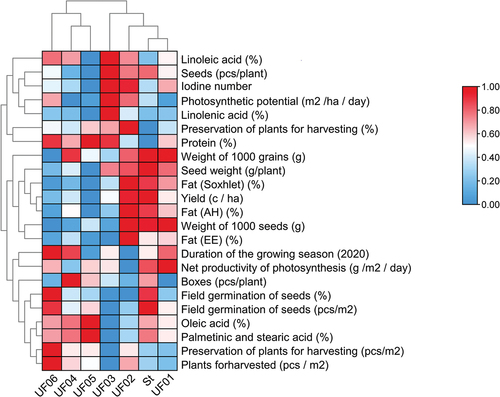
Figure 8. General situation analysis.