Figures & data
Figure 1. FTIR spectra of PA-12/CuONPs before and after dyes’ adsorption.
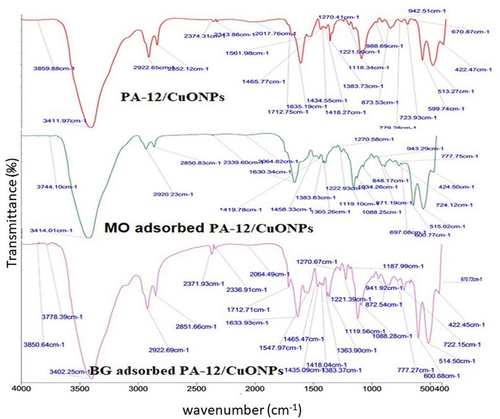
Figure 2. BET adsorption – desorption isotherm.
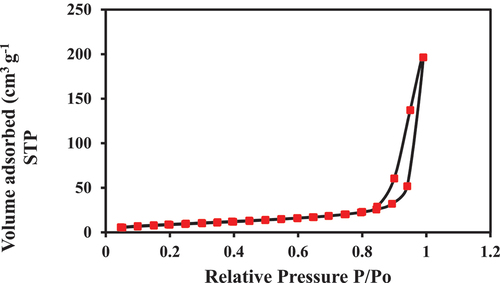
Figure 3. HR-TEM of PA-12/CuONPs at different magnifications.
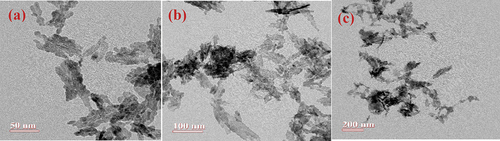
Figure 4. SEM images of PA-12/CuONPs (a-b), MO adsorbed PA-12/CuONPs (c), BG adsorbed PA-12/CuONPs (d).
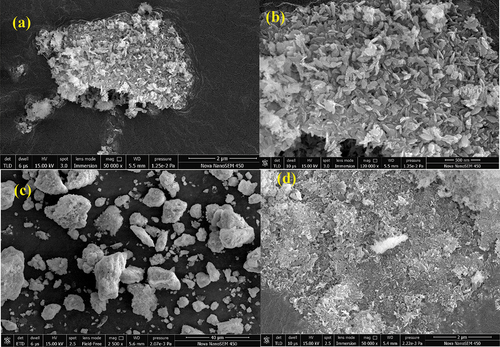
Figure 5. Elemental mapping of PA-12/CuONPs (a), MO adsorbed PA-12/CuONPs (b), BG adsorbed PA-12/CuONPs (c).
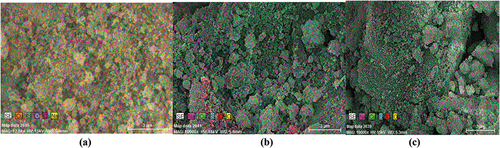
Figure 6. EDS analysis of PA-12/CuONPs (a), MO adsorbed PA-12/CuONPs (b), BG adsorbed PA-12/CuONPs (c).
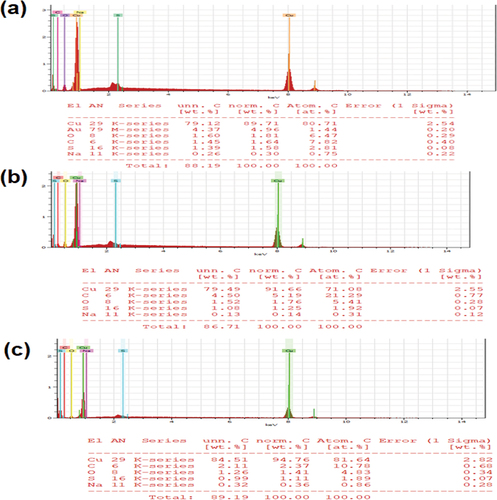
Figure 7. XRD pattern of PA-12/CuONPs (a), CuO nanoparticles (b) and PA-12 (c).
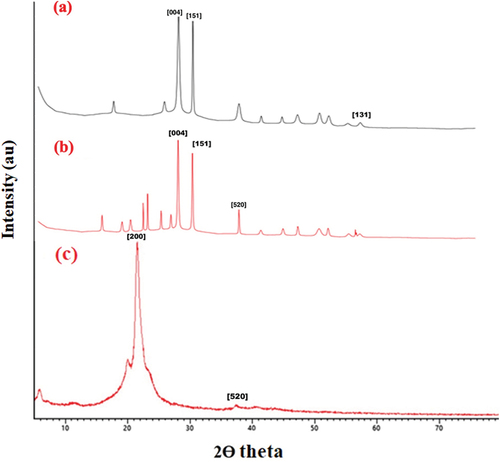
Figure 8. Thermogravimetric analysis (TGA) of PA-12/CuONPs.
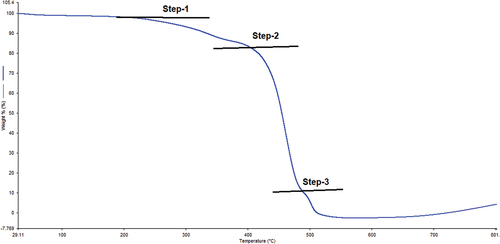
Figure 9. Effect of pH on MO and BG adsorption onto PA-12/CuONPs.
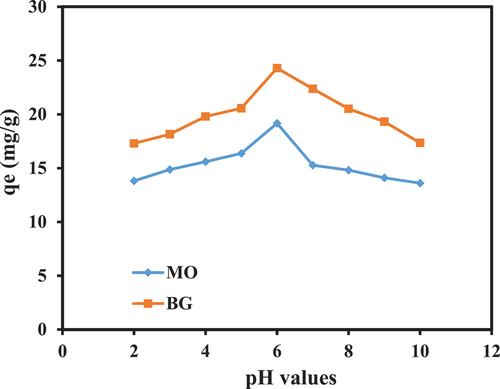
Figure 10. Point of zero charge of PA-12/CuONPs.
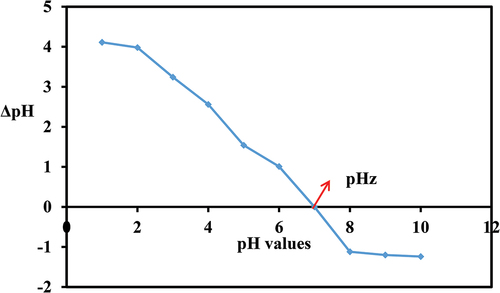
Figure 11. Adsorption isotherm: Langmuir (a), Freundlich (b), Temkin (c) and D-R (d).
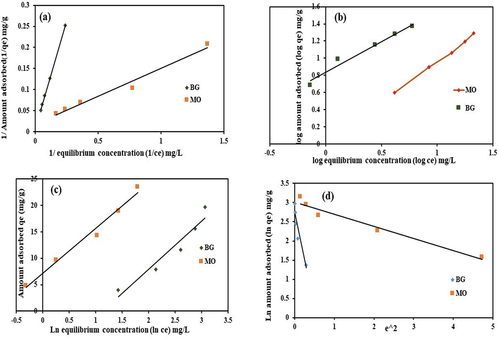
Table 1. Adsorption isotherm parameters of dyes’ adsorption onto PA-12/CuONPs.
Figure 12. Vant’s Hoff plot.
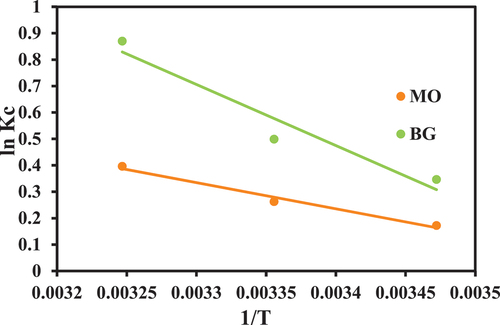
Table 2. Thermodynamic parameters of dyes’ adsorption onto PA-12/CuONPs.
Figure 13. Adsorption Kinetics: Pseudo-first-order (a), Pseudo-second-order (b), Elovich (c), Intraparticle diffusion (d).
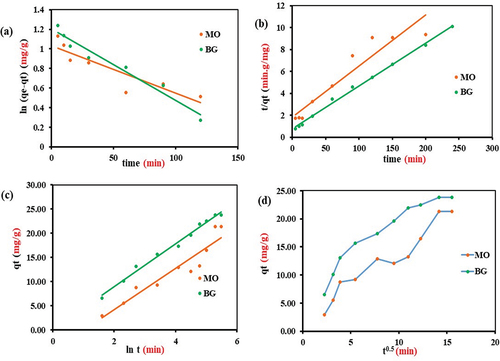
Table 3. Kinetic parameters of dyes’ adsorption onto PA-12/CuONPs.
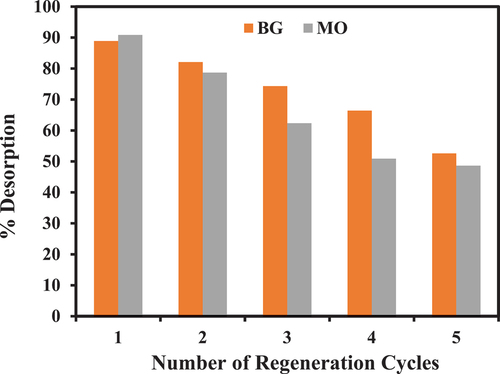
Figure 14. Desorption efficiency of PA-12/CuONPs.