Figures & data
Figure 1. The illustration of section variability. (a) Longitudinal variation: (a1): bottom section, (a2): medium section, and (a3): upper section. (b) Radial variation: (b1): outer convex zone, (b2): middle zone, (b3): inner zone, and (b4): outer concave zone.
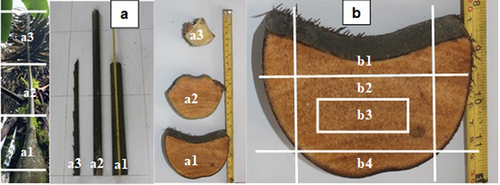
Figure 2. An illustration of area occupation measure of FVB. (a) Total transverse area; (b) Non-vascular tissue area;(c) Vascular tissue area.
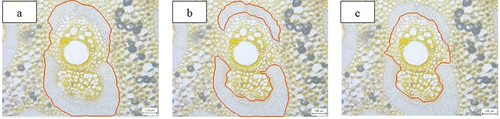
Figure 3. An illustration of testing the FVB mechanical properties.
Figure 4. The Cross-section image of sugar palm frond (magnification 10×): a: sclerenchyma fiber; b: metaxylem vessel; c and d: parenchyma cell; e: phloem; f: sclerenchyma sheath protoxylem.
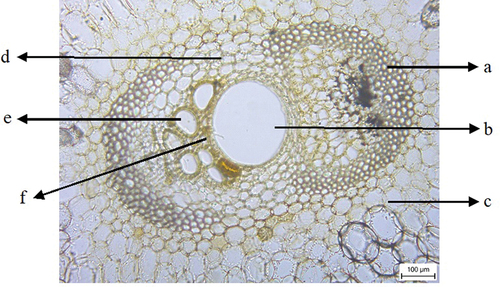
Figure 5. Cross-sectional image of frond upper, middle and bottom section: (a): outer convex zone, (b): outer concave zone, (c): middle zone, and (d): inner zone. Note: (1) is a representation of 4× magnification, and (2) is a representation of 10× magnification.
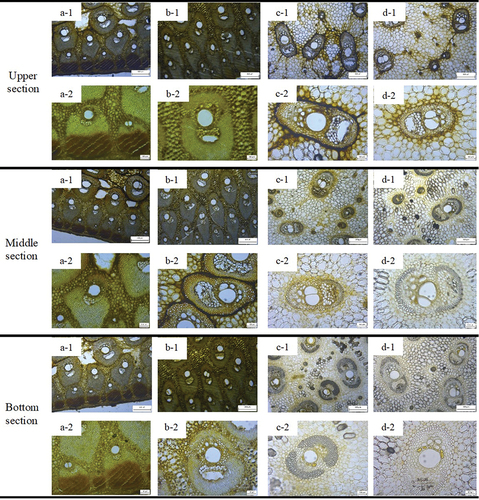
Table 1. The variability of anatomical and physical properties on bottom section of fronds.
Table 2. The variability of anatomical and physical properties on middle section of frond.
Table 3. The variability of anatomical and physical properties on upper section of fronds.
Figure 6. Histogram of longitudinal and radial variability of fiber morphology. a. Fiber length; b. Fiber diameter; c. Lumen diameter; and d. Fiber wall thickness. (Note: bar chart is representation of the standard deviation, means with the same letter are not significantly different from each other (P > 0.05 ANOVA followed by Duncan multiple range test).
Table 4. Fiber derivatives of FVB’s of A. longipes frond.
Figure 7. Histogram of longitudinal and radial variability of mechanical properties. a. tensile strength; and b. Young’s modulus. (Note: bar chart is representation of the standard deviation, Means with the same letter are not significantly different from each other (P > 0.05 ANOVA followed by Duncan multiple range test).
Figure 8. The relationships between density and mechanical properties (a. Tensile strength; b. Young’s modulus) as well as VTA:TTA ratio and mechanical properties (c. Tensile strength: d. Young’s modulus).