
Figures & data

Figure 1. Work flowchart.
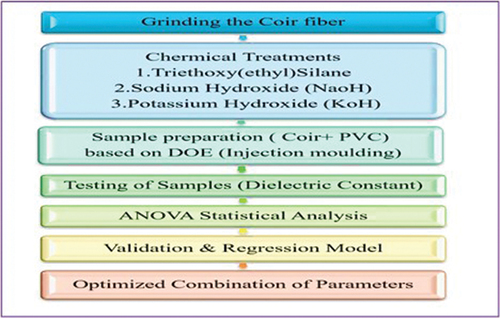
Table 1. Physical properties of coir and PVC.
Figure 2. BBD for three factors.
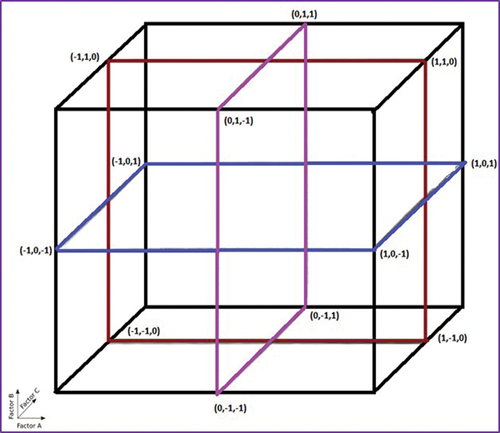
Table 2. Parameters for experimental strategy.
Table 3. The arrangement of the BBD.
Figure 3. Grinding of coir fiber.
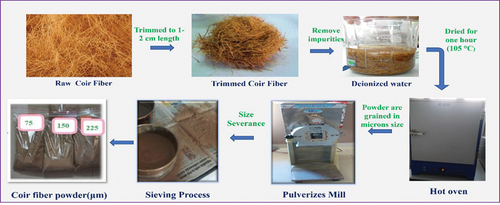
Figure 4. Chemical treatment procedure.
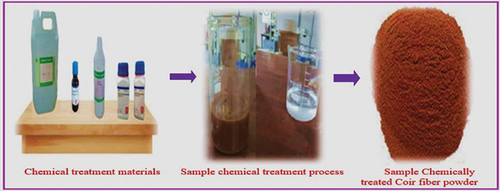
Figure 5. Dielectric constant (resonance method).
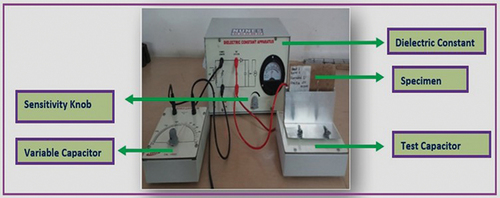
Table 4. Experimental DC.
Table 5. ANOVA outcomes for DC.
Table 6. Dielectric constant (regression equation).
Table 7. Comparison between experiment and regression equation for DC.
Figure 6a. Surface plot of DC vs. particle size (μm) and fiber content (%).
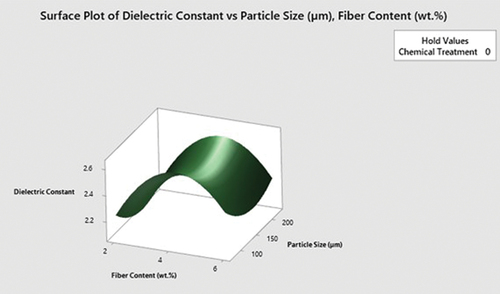
Figure 6b. Surface plot of DC vs. chemical treatment (%) and fiber content (%).
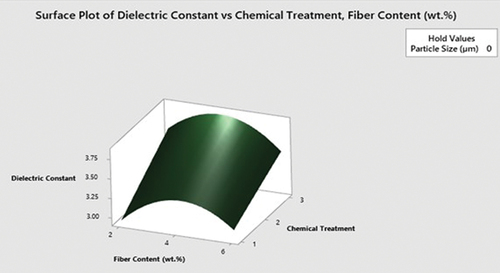
Figure 6c. Surface plot of DC vs. chemical treatment (%) and particle size (μm).
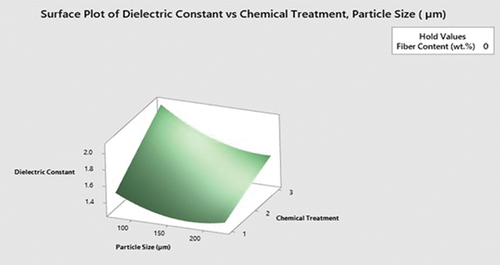
Figure 7. Main effects plot for DC.
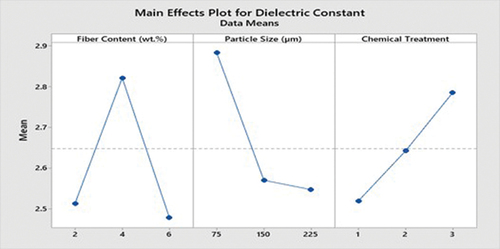
Figure 8. Pareto chart of the standardized effects.
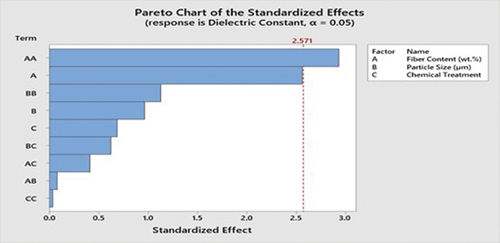
Figure 9. Response optimization plot.
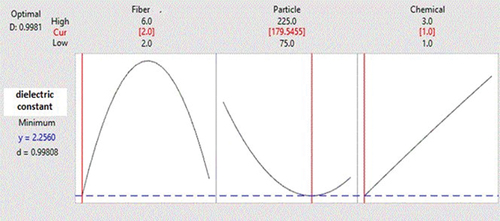
Table 8. Criterion for optimization.
Table 9. Optimized set of variables.