Figures & data
Figure 1. A fibrogram and its association with the current HVI length parameters.
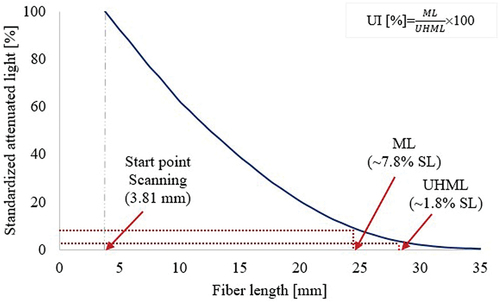
Table 1. Descriptive statistics of 60 commercial-like samples from the 2016 crop year.
Figure 2. The amount of variation explained (R2) in yarn tenacity (g/tex) by different yarn quality prediction models.
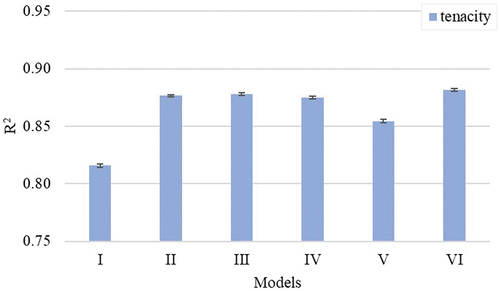
Figure 3. Performance of different yarn quality models while predicting yarn tenacity (g/tex) based on MSE.
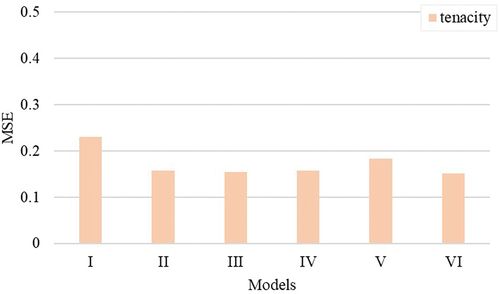
Figure 4. The amount of variation explained (R2) in yarn work-to-break by different yarn quality prediction models.
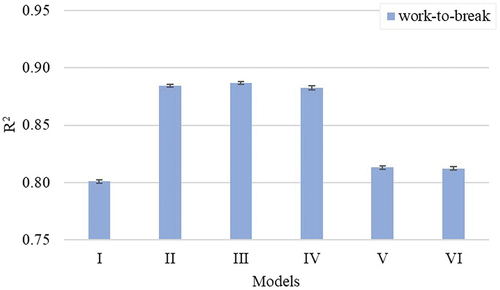
Figure 5. Performance of different yarn quality models while predicting yarn work-to-break based on MSE.
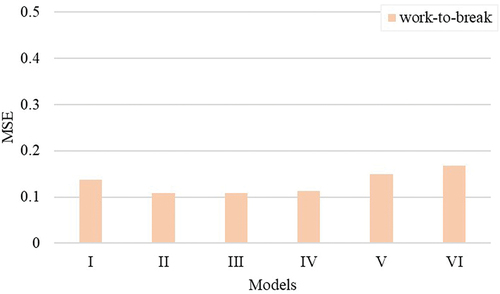
Figure 6. The amount of variation explained (R2) in yarn coefficient of mass variation (CVm %) by different yarn quality prediction models.
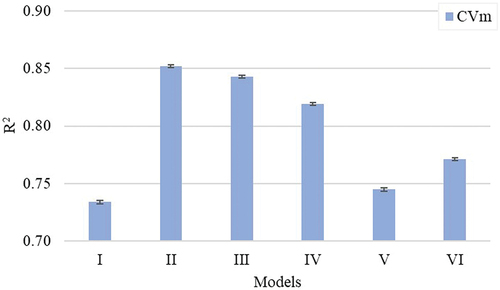
Figure 7. Performance of different yarn quality models while predicting yarn coefficient of mass variation (CVm %) based on MSE.
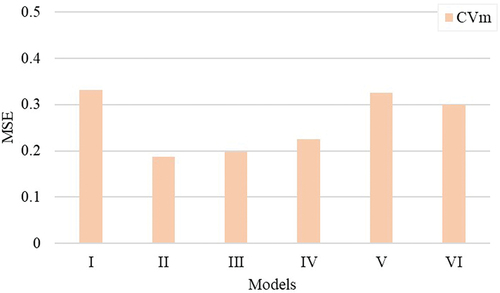
Figure 8. The amount of variation explained (R2) in yarn thin places − 50% (counts/km) by different yarn quality prediction models.
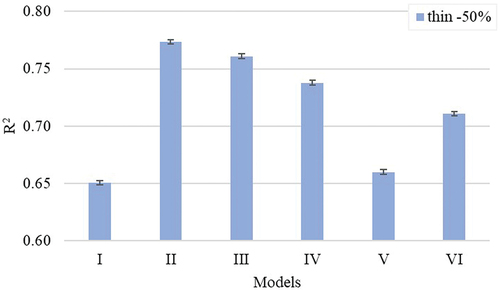
Figure 9. Performance of different yarn quality models while predicting yarn thin places − 50% (counts/km) based on MSE.
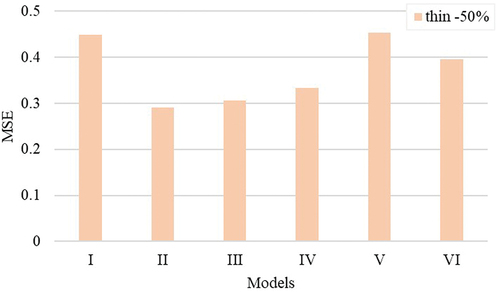
Figure 10. The amount of variation explained (R2) in yarn thick places + 50% (counts/km) by different yarn quality prediction models.
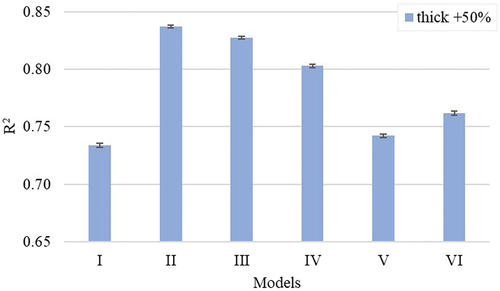
Figure 11. Performance of different yarn quality models while predicting yarn thick places + 50% (counts/km) based on MSE.
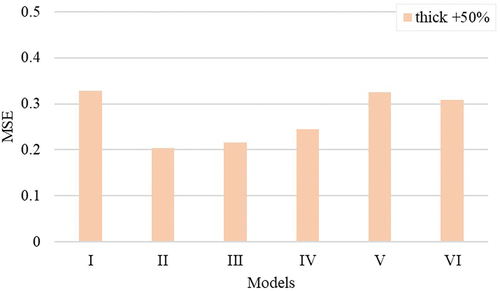
Figure 12. The amount of variation explained (R2) in yarn neps + 200 (counts/km) by different yarn quality prediction models.
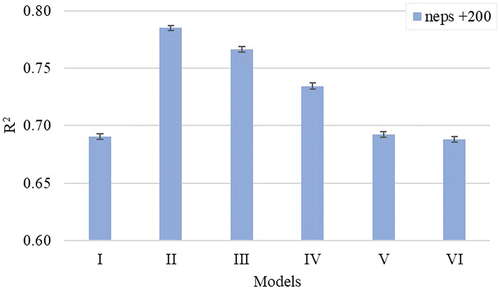
Figure 13. Performance of different yarn quality models while predicting yarn neps + 200 (counts/km) based on MSE.
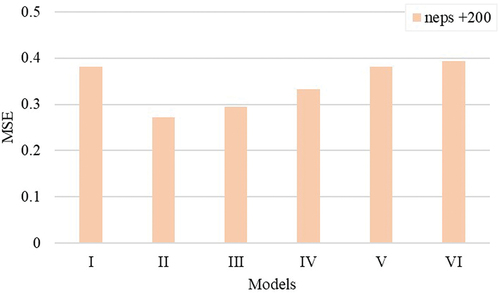
Figure 14. The amount of variation explained (R2) in yarn hairiness by different yarn quality prediction models.
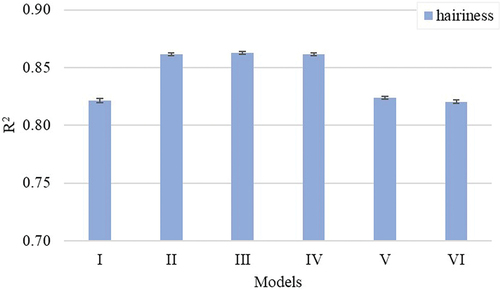
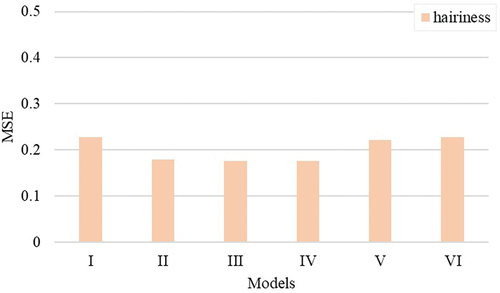
Figure 15. Performance of different yarn quality models while predicting yarn hairiness based on MSE.