
Figures & data
Figure 1. Water Jasmine (Wrightia religiosa Benth.).
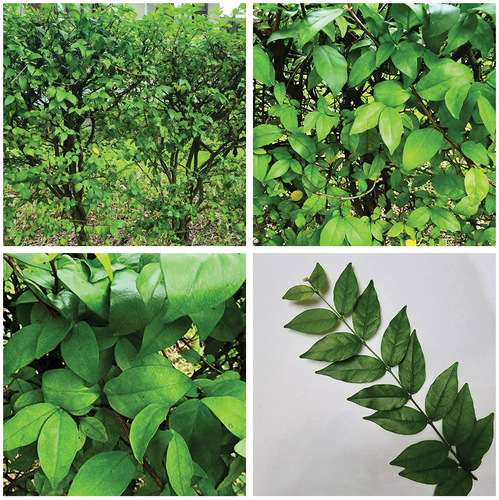
Figure 2. Reaction of indigo dyeing.
Figure 3. The bar charts of L*, a*, b*, C*, h*, and K/S values were compared among AL1, AL2, and AL3 as shown in (a), (b), (c), (d), (e), and (f), respectively.
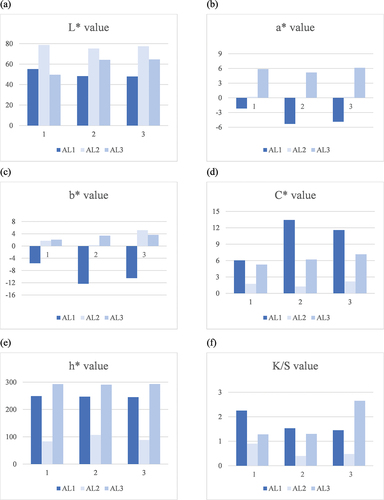
Table 1. The color values of K/S and CIELAB (L*, a*, b*, C*, h*) of the dyed silk with Water Jasmine using different alkaline before laundering.
Figure 4. The bar chart of DL*, Da*, Db*, DC*, DH*, and DE* values were compared among AL1, AL2, and AL3 as shown in (a), (b), (c), (d), (e), and (f), respectively.
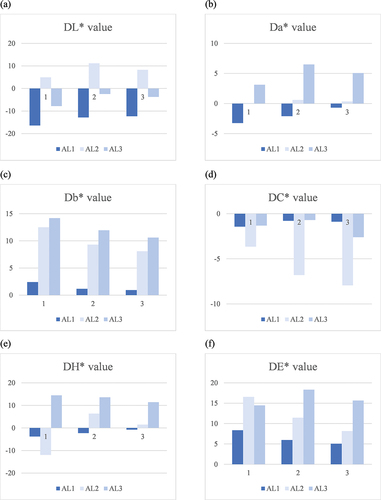
Table 2. Color differences after laundering test of the dyed silk with Water Jasmine using different alkalines.
Table 3. The total color differences of the dyed silk with Water Jasmine using different alkalines after laundering test compared with grayscale.