Figures & data
Figure 1. ANOM-decision chart with decision limits 38.72 to 50.84 for seed cotton yields across normal and salt stress (α > 0.05%). It provides a graphical test for simultaneously comparing the mean performance of these 32 cotton genotypes across normal and salt stress. Red-colored heads represent a significant deviation from the mean, either above the upper-decision level (UDL) or below the lower decision level (LDL).
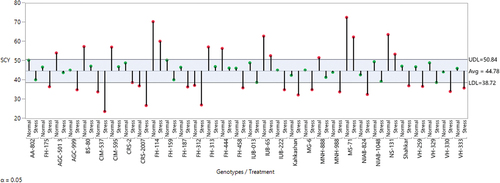
Table 1. Generalized linear Model effect test ANOVA for genotypes under study across normal and salt stress conditions.
Figure 2a. A & b. All pairwise comparisons for biochemical, yield and fiber-related traits under normal and stress conditions, red color bars represent significant comparisons whereas blue color bars indicate non-significant differences in comparisons for traits under study.
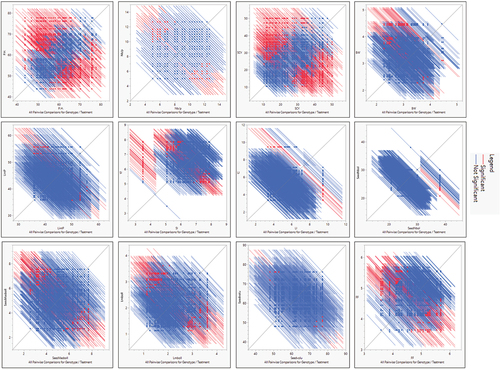
Figure 2b. Continued.
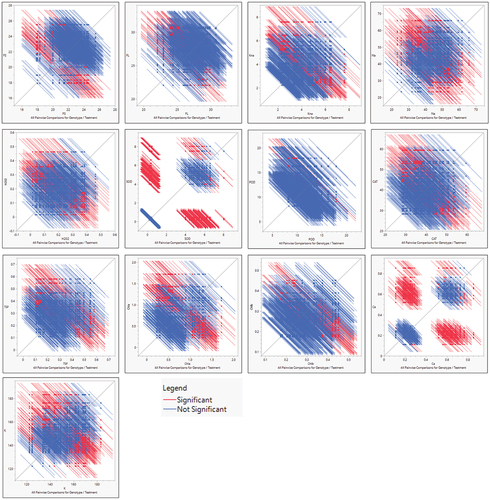
Figure 3. Prediction profile plot with highest adjusted desirability and factor values for all studied agronomic, biochemical and fiber quality traits of 24 cotton genotypes under normal and salt stress conditions.
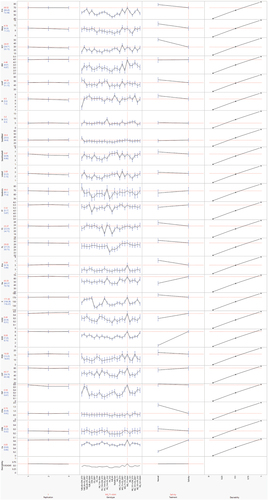
Figure 4. Scatterplot matrix to visualize several attributes by pairwise dependencies of different traits under study across normal and heat stress conditions. The upper triangle matrix represents correlations among biochemical, yield and fiber-related traits under normal and stress conditions. The lower triangle matrix reveals bivariate density distribution with ellipses between each pair of attributes. The legends at the top right corner of the color gradient (red to blue), and the size of circles show the amount of correlation and log (p) values for the significance threshold, respectively.
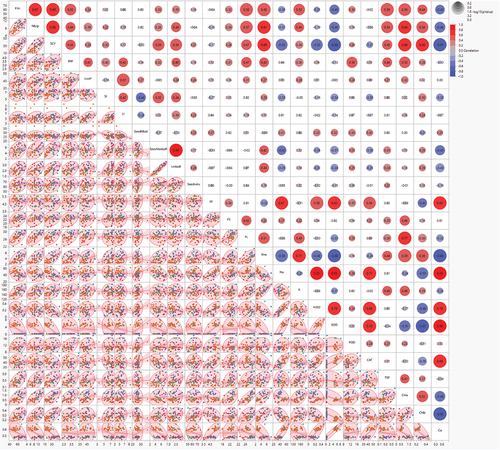
Figure 5. Agglomerative hierarchical clustering (AHC) calculates the Euclidean distance matrix of 24 cotton genotypes for biochemical, yield and fiber-related traits under normal and stress conditions. The plot was constructed in JMP pro. V. 16 (SAS Institute Inc., Cary, NC, USA) using Ward’s minimum variance on standardized data. The horizontal and vertical axes represent clades formation based on the division of traits and genotypes, respectively, following the two-way clustering approach.
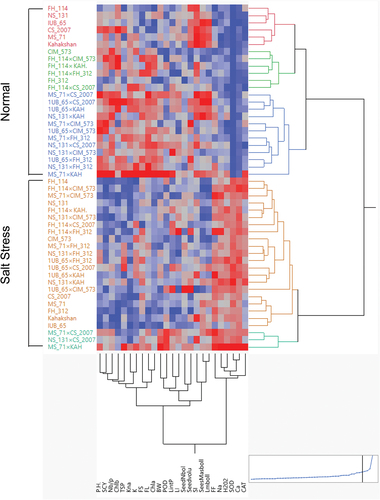
Figure 6. Summary plots with (leftmost) biplot between PC1 and PC2 displaying the distribution of traits; the biplot (center) of 24 cotton genotypes under normal and salt stress conditions; (right), scree plot showing the number of components to be considered for variability coverage through PCA.
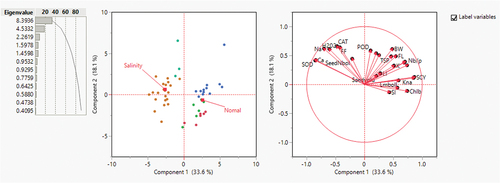
Figure 7. Scatterplot matrices of PC1, PC2 and PC3 displays different traits and genotypes under normal and salt stress conditions. Different color dots across coordinates of scatter plots show the placement of genotypes under salinity stress, whereas different color shapes in scatterplots represent placement genotypes under normal conditions. Different color schemes represent the grouping of genotypes across stress and normal conditions.
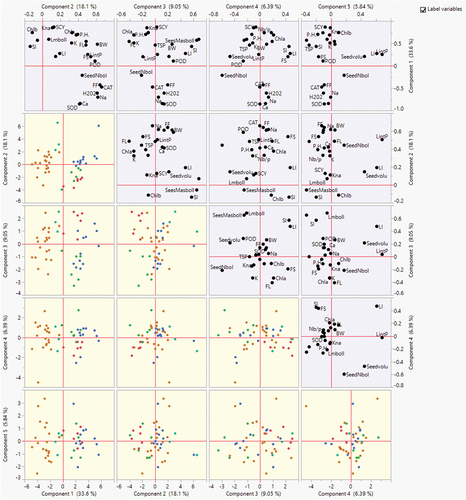
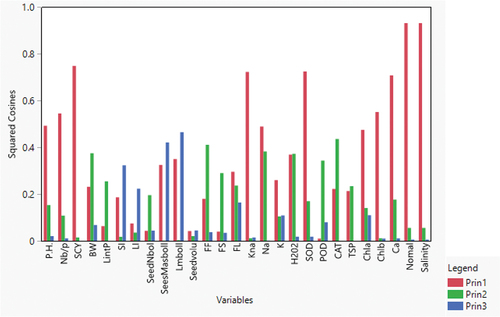
Figure 8. Squared cosines are associated with the principal components for the studied traits under normal and salt stress conditions.