
Figures & data
Figure 1. a) location of the sampling point of the marine clay at Kuala Langat, Selangor, Malaysia, and b) marine clay at the site.
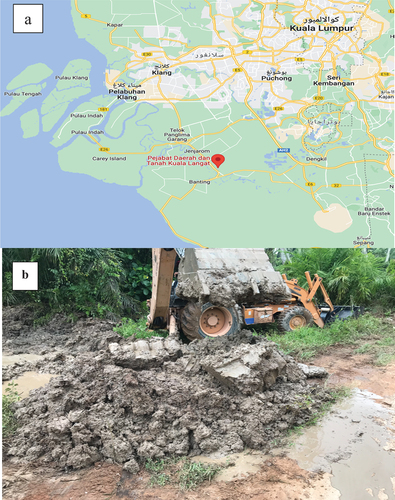
Figure 2. Particle size distribution for marine clay, lime, CS and POFA.
Table 1. Physical properties of marine clay.
Table 2. The chemical composition of marine clay, CS and POFA.
Table 3. The physical and chemical composition of lime.
Table 4. Mixture proportions of test specimens part (1).
Table 5. Mixture proportions of test specimens part (2).
Figure 3. FESEM images for untreated marine clay (S).
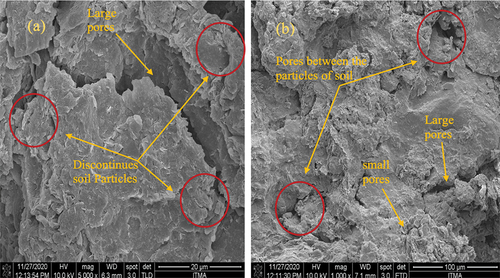
Figure 4. FESEM images for palm oil fuel ash (POFA).
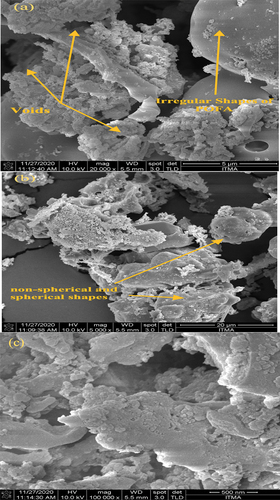
Figure 5. FESEM images for lime.
Figure 6. FESEM images for calcined shale.
Figure 7. X-Ray diffraction results of marine clay, POFA, Lime and calcined shale.
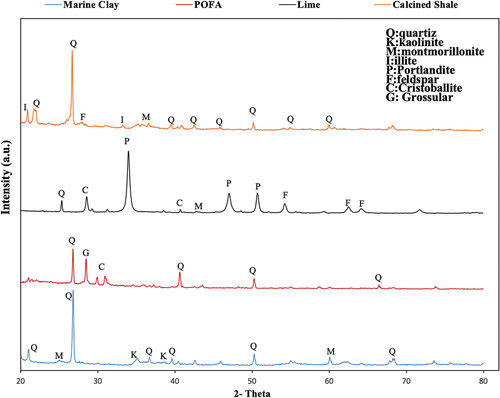
Figure 8. Influence of 5% lime and various percentages of POFA on the consistency limits (a) liquid limits (LL), (b) plastic limits (PL), (c) Plasticity index (PI), and (d) shrinkage limits of Marine clay (part 1).
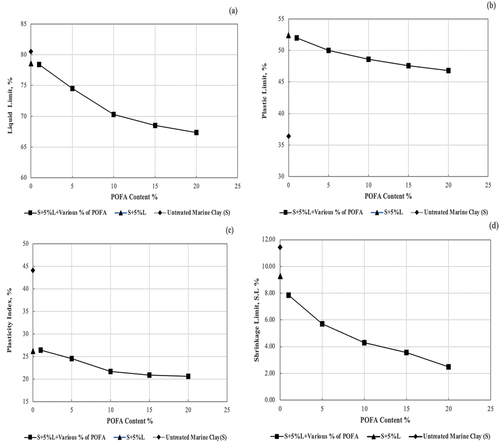
Figure 9. Effect of various percentages of POFA, lime and CS on specific gravity of Marine clay.
Figure 10. Dry unit weight-moisture content relationship of natural Marine clay and stabilized soil with 5% lime and different percentages of POFA.
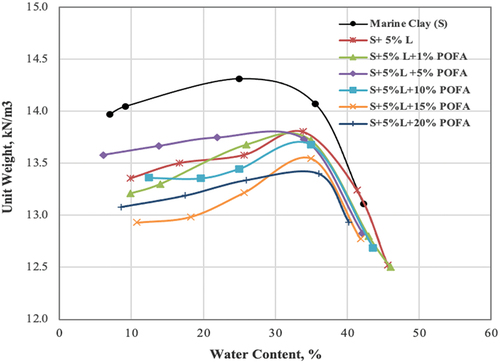
Figure 11. Influence of 5% lime and various percentages of POFA on the a) maximum dry Density(MDD) and b) optimum water Content(OMC) of marine Clay.
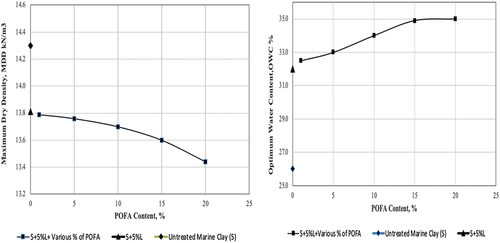
Figure 12. Influence of 5% lime (L) and different percentages of POFA on the axial stress – changes in void ratio relationship of Marine clay.
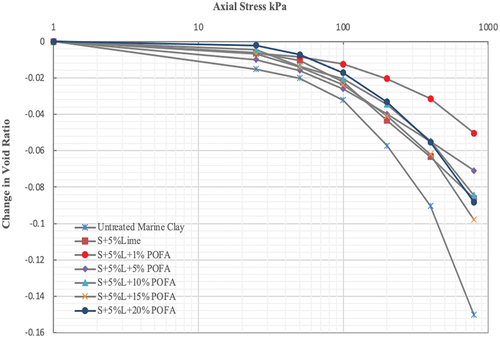
Table 6. Influence of 5% lime and different percentages of POFA on compression and consolidation parameters.
Table 7. Standard deviation for the results of part (1).
Figure 13. Liquid limits (LL), (b) plastic limits (Pl),(c) plasticity index (PI) and (d) shrinkage limits of marine clay treated with 5% POFA, various percentages of lime and CS.
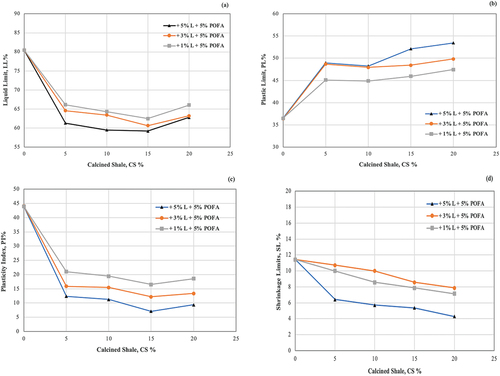
Figure 14. Comparison between results of part (1) and the optimum proportion of part (2).
Figure 15. Effect of POFA, lime (L) and CS on the specific gravity of marine clay.
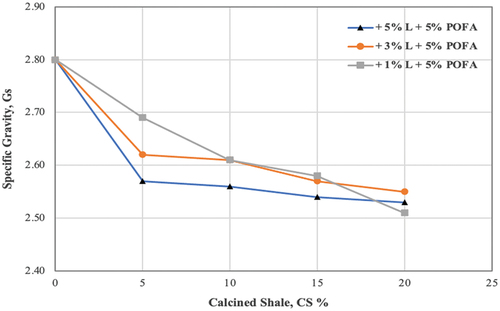
Figure 16. Results of specific gravity for part (1) and the optimum proportion of part (2).
Figure 17. Influence of blended lime (L), POFA and calcined shale (CS) on the unit weight and optimum water content of marine clay soil.
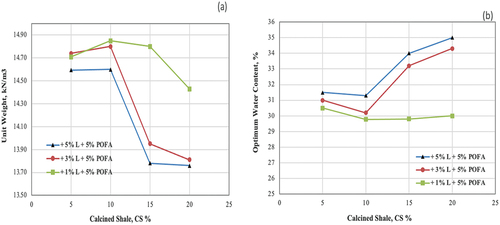
Figure 18. Compaction relationship of marine clay stabilized soil with lime, POFA and CS.
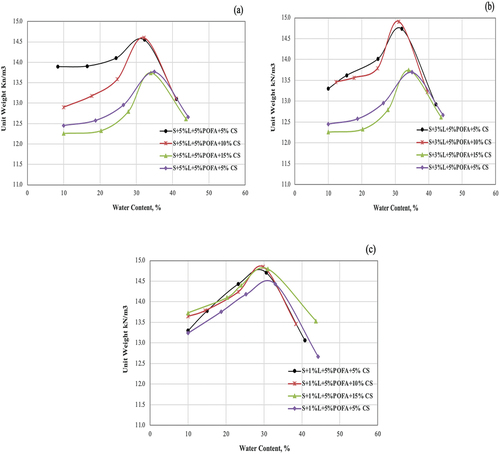
Figure 19. Comparison of compaction test results part (1) and (2).
Table 8. Standard deviation for the results of part (2).
Figure 20. FESEM images for S + 3%L + 5%POFA +10%CS mixture after 7 days of curing and at different magnification.
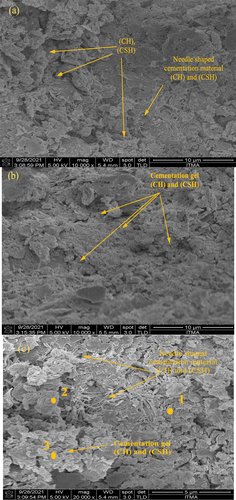
Table 9. Energy dispersive X‐Ray (EDX) element for different specimens at 7 days curing periods.
Figure 21. X-Ray diffraction results of marine clay and S + 3%L + 5%POFA +10%CS after 7 days of curing.
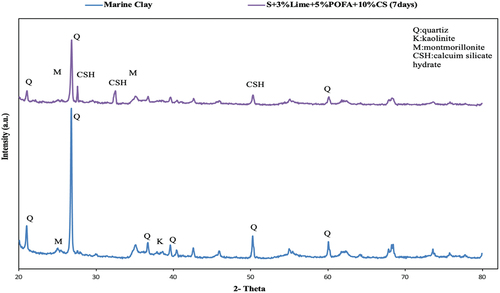
Table 10. X-Ray fluorescence test for different specimens at 7 days curing periods.