Figures & data
Figure 1. The shape of the profile created along the warp of the plain woven fabric; SMDwarp =18.428 mm.
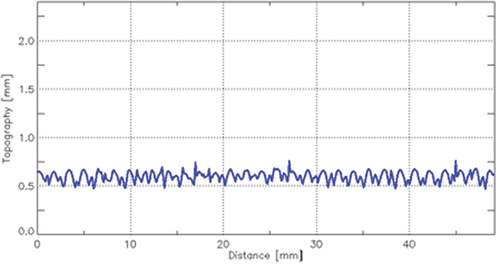
Figure 2. The shape of the profile created along the warp of the hopsack woven fabric; SMDwarp =18.481 mm.
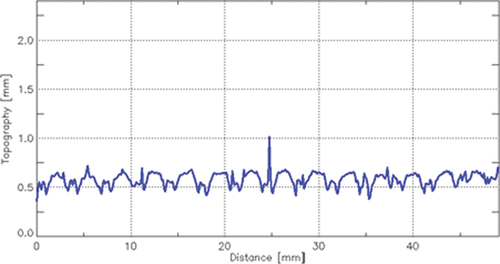
Figure 3. Sensors of the KES-FB4 tester.
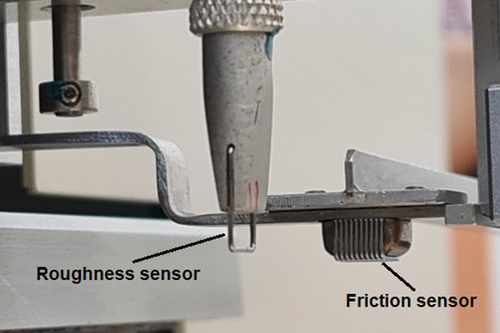
Figure 4. Relationship between the geometric structure of surface and functional properties of fabrics.
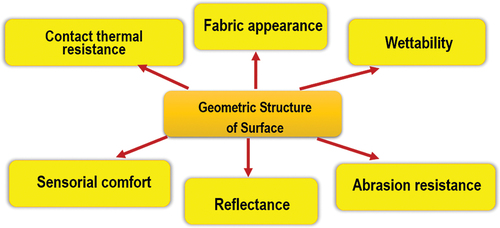
Table 1. The basic structural parameters of the investigated fabrics.
Figure 5. The MicroSpy® profile profilometer applied in measurements.
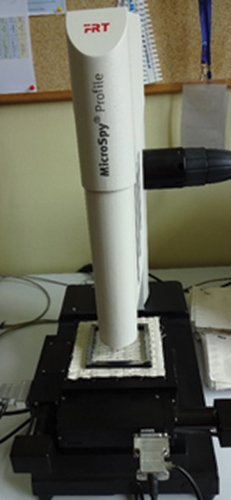
Figure 6. Exemplary picture of row data from the profilometer for the twill fabric.
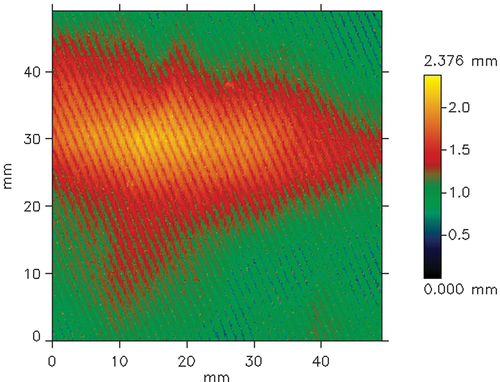
Figure 7. Exemplary picture of data from the profilometer after waviness elimination for the twill fabric.
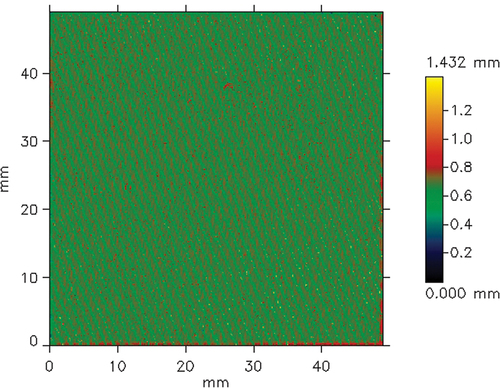
Table 2. Results of profilometric measurement of surface geometry of the woven fabrics.
Figure 8. The interpretation of the ra parameter.
Figure 9. The interpretation of the Rq parameter.
Figure 10. The comparison of the ra and rq parameters for the plain and twill fabrics.
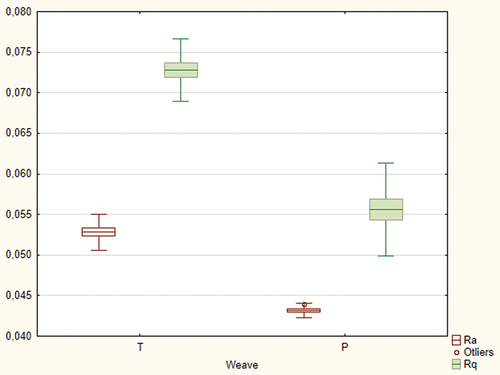
Figure 11. The comparison of the roughness parameters for the plain and twill fabrics.
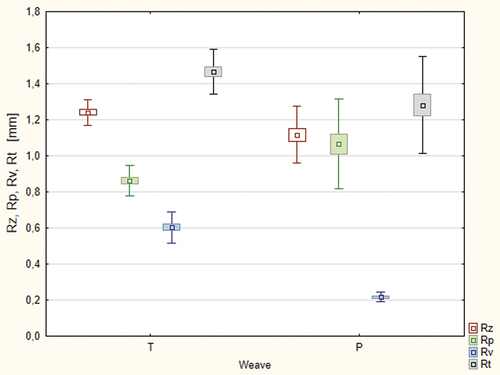
Table 3. The results of the one-way Anova for the parameters characterizing the surface geometry of the investigated cotton woven fabrics.
Figure 12. Exemplary profile of the investigated fabric sample: a) placement of the profile, b) shape of the profile.
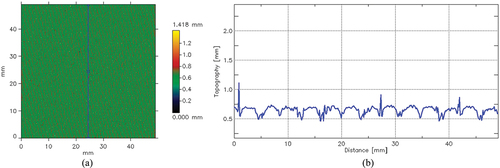
Figure 13. Exemplary profiles of the plain woven fabric: a – along the warp (blue line), b – weft (red line).
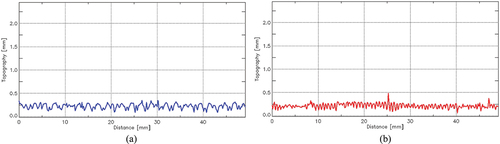
Figure 14. Exemplary profiles of the twill woven fabric: a – along the warp (blue line), b – weft (red line).
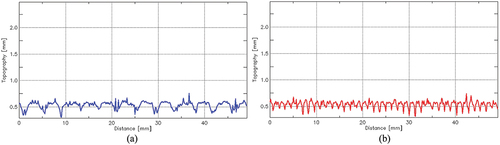
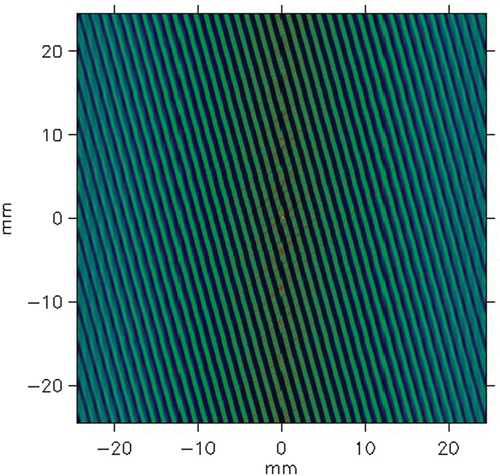
Figure 15. Exemplary distribution of height (z value) on the plain fabric surface.
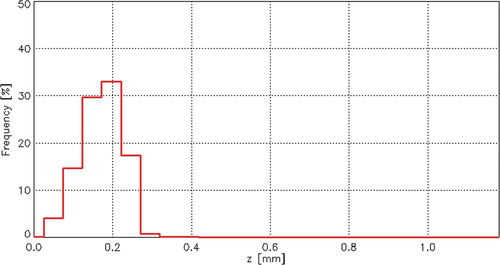
Figure 16. Exemplary distribution of height (z value) on the twill fabric surface.
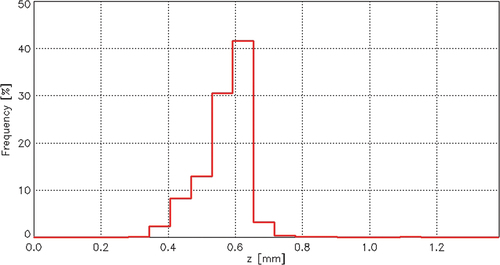
Table 4. The data from the histograms illustrated the height distribution on the fabric surface.
Figure 17. Exemplary autocorrelation function for the plain woven fabric.
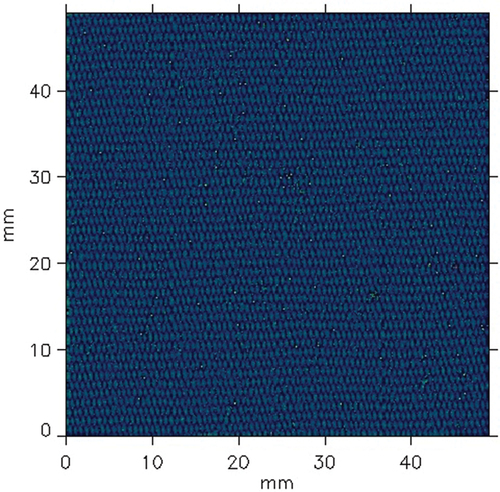
Figure 18. Exemplary autocorrelation function for the twill woven fabric.