
Figures & data
Figure 1. Process flow chart of BFs preparation.
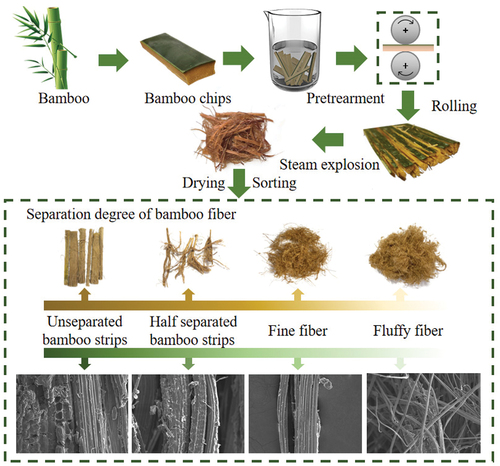
Table 1. The design of the level of orthogonal experimental factor.
Table 2. The number of BFs obtained under different steam explosion processes.
Figure 2. (a) Yields of different types of BFs under different steam explosion processes. (b) Changes in color parameters of BFs under different steam explosion process.
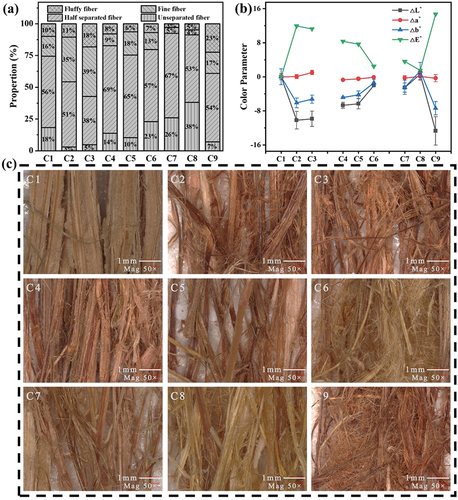
Table 3. Orthogonal experimental combination and results for different steam exploded BFs.
Table 4. Orthogonal experimental ANOVA for different steam exploded BFs.
Figure 3. Changes in (a) length and (b) diameter of BFs under different steam explosion processes.
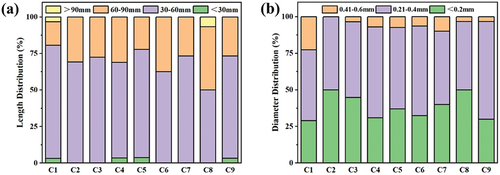
Figure 4. (a) Surface and (b) cross-section microstructure of BFs under different steam explosion processes.
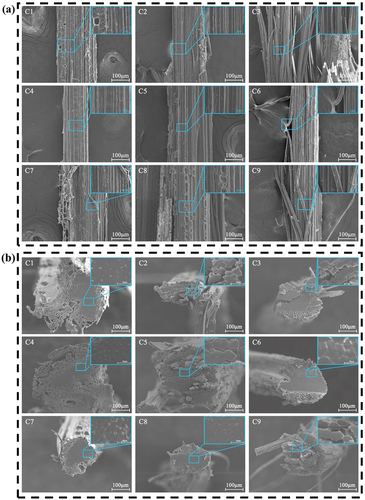
Figure 5. (a) FT-IR spectra and (b) XRD pattern of BFs under different steam explosion processes.
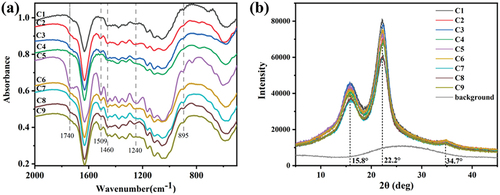
Figure 6. EMC values of BFs under different steam explosion processes plotted against relative humidity during (a) adsorption and (b) desorption.
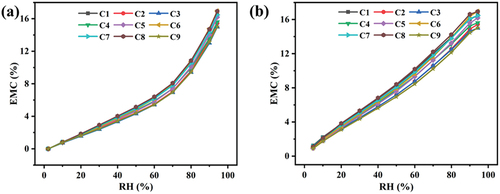
Figure 7. (a) Hysteresis and (b) hysteresis coefficient of BFs under different steam explosion processes.
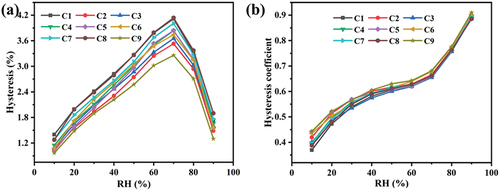
Figure 8. (a) TG and (b) DTG curves of BFs under different steam explosion processes.
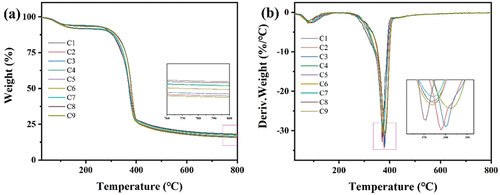
Table 5. Thermogravimetric data of BFs under different steam explosion processes.
Data availability statement
The data that support the findings of this study are available from the corresponding author upon reasonable request.