Figures & data
Table 1. Mass spectrometry information of terpenoids.
Figure 1. UHPLC-MS/MS mass spectrum of pineapple fiber. A represented the positive ion chromatogram, B represented the negative ion chromatogram, and C represented the peak value of total terpene content.
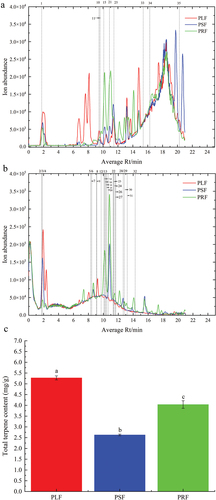
Figure 2. Proportion and molecular formula of different terpenoids in different pineapple fibers.
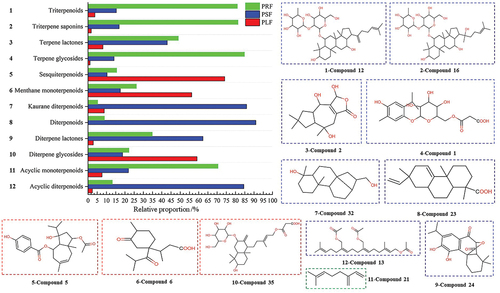
Figure 3. S-plot analysis of terpenoids in pineapple fibers. A represented VIP values of terpenoids in three pineapple fibers, and B, C and D represented S-plot diagrams of PLF-PSF, PLF-PRF and PSF-PRF, respectively.
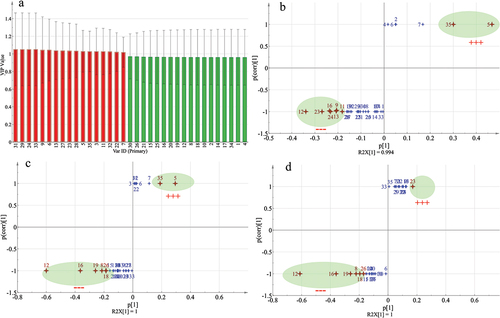
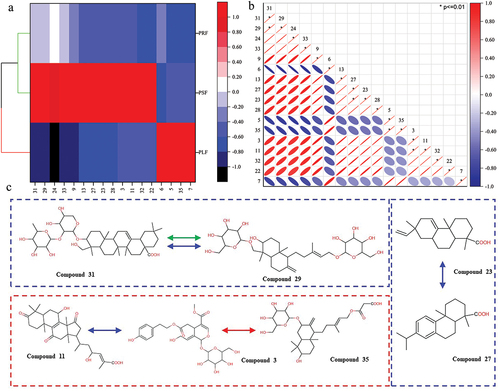
Figure 4. Thermogram and correlation analysis of terpenoids in three kinds of pineapple fibers. A represented thermographic analysis of terpenoids. B represented the correlation analysis of terpenoids. C represented the structural formula of differential terpenoids.