Figures & data
Table 1. Experimental range and levels of central composite design.
Figure 1. GP-RHA hybrid coating showing (a) actual sample and (b) sample schematic diagram.
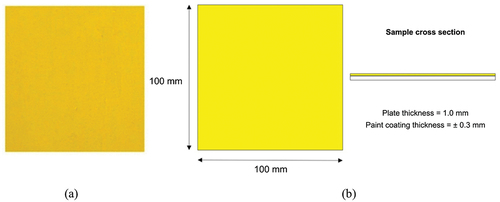
Table 2. Design compositions of GP-RHA.
Table 3. Design composition and adhesion value for dry pull-off adhesion test.
Table 4. ANOVA analysis for pull-off adhesion strength.
Figure 2. Effect GP-RHA and alkyd paint on adhesion strength contour plot.
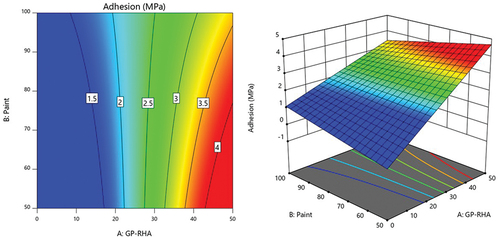
Figure 3. Optimum conditions and response for adhesion strength.
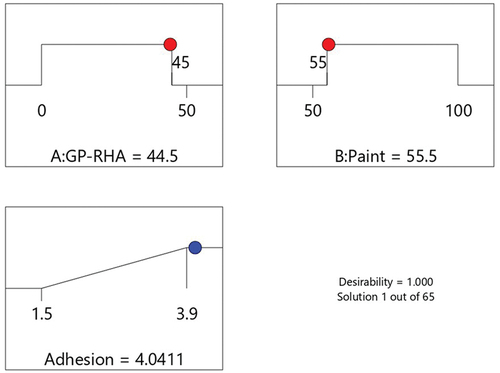
Table 5. Ratio and responses for sample alkyd, GPHC26 and GPHC29 for pull-off adhesion test.
Figure 4. SEM micrograph of the sample GPHC26 surface (a) at 500× of magnification (b) at 5000× of magnification.
Figure 5. SEM micrograph of the sample GPHC29 surface (a) at 500× of magnification (b) at 5000× of magnification.
Figure 6. Cross Section SEM micrograph of the sample GPHC26 (a) at 100× of magnification and (b) at 500× of magnification.
Figure 7. Cross Section SEM micrograph of the sample GPHC29 (a) at 100× of magnification and (b) at 500× of magnification.
Figure 8. SEM and EDX analysis composition for sample GPHC26.
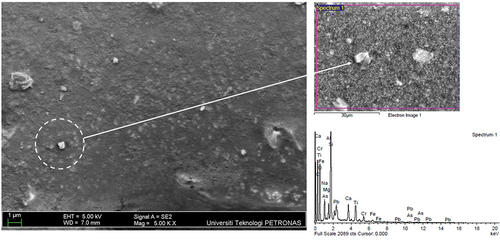
Figure 9. SEM and EDX analysis composition for sample GPHC29.
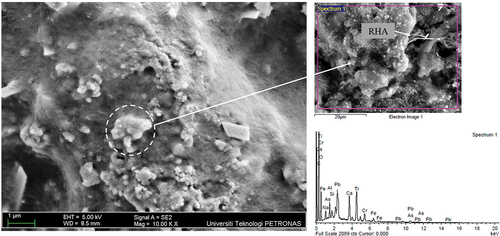
Table 6. EDX analysis for sample GPHC26 and GPHC29.
Figure 10. The pull-off adhesion test result for measuring the dry adhesion and wet adhesion strength.
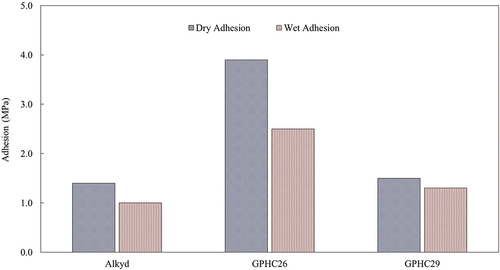
Table 7. Ratio and adhesion strength for sample alkyd, GPHC26 and GPHC29 for pull-off adhesion test.
Figure 11. Coating sample after 500 h immersion in 3.5 wt.% NaCl solution showing (a) efflorescent effect with crystalline deposits on the surface of alkyd paint, (b) swelling on on the edge part of GPHC26 specimen and (c) no visual defect on GPHC29.
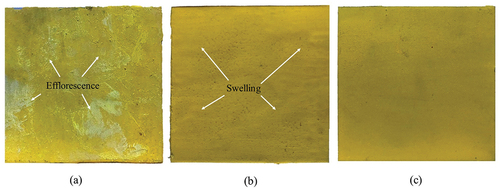
Figure 12. SEM micrograph after wet environment test simulation showing (a) several cracks occurred on the coating surface for alkyd, (b) swelling and unreacted particles on GPHC26 coating surface and (c) micro pores on the GPCH29 coating surface.