
Figures & data
Figure 1. Single fiber tensile test sample.
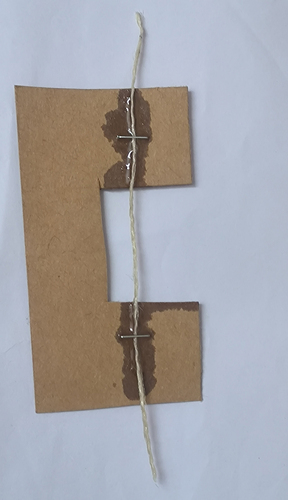
Figure 2. Pictorial depicting the process followed to obtain the mass percentage of chemical constituents in Bamboo fibers.
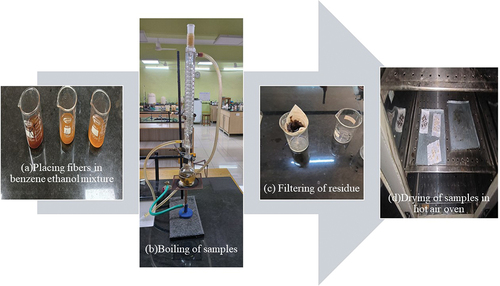
Figure 3. Tensile strength of sodium hydroxide treated and ammonium hydroxide treated bamboo fibers.
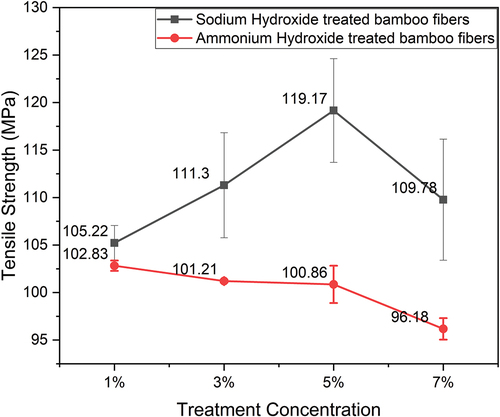
Figure 4. Tensile strength of potassium permanganate treated bamboo fibers.
Figure 5. Comparison of tensile strength of treated and untreated bamboo fibers.
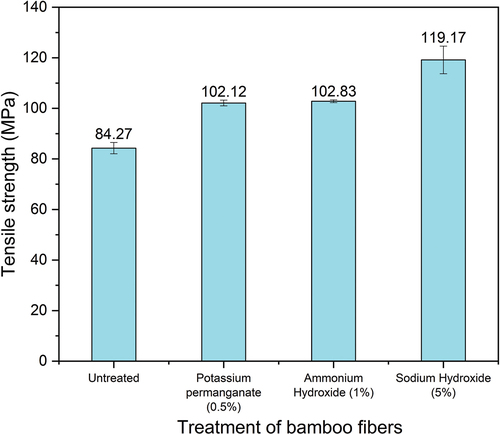
Table 1. Chemical constituents of treated and untreated bamboo fibers.
Figure 6. XRD spectrum of treated and untreated bamboo fibers.
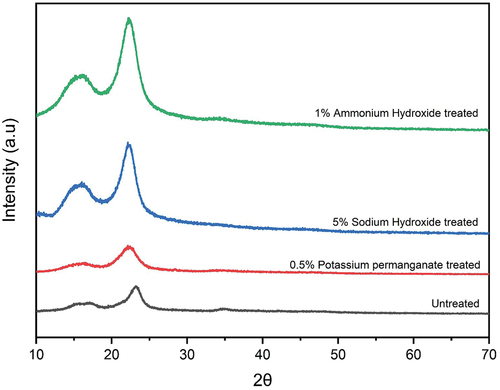
Figure 7. Degree of crystallinity of treated and untreated bamboo fibers.
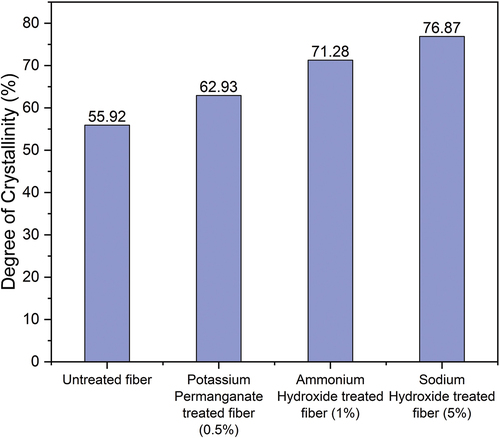
Figure 8. FTIR spectrum of treated and untreated bamboo fibers.
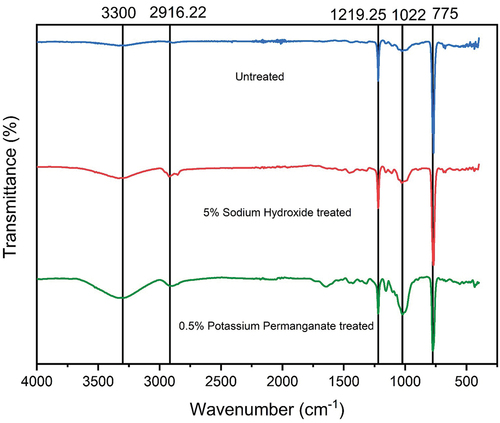
Figure 9. SEM images of (a) untreated bamboo fibers, (b) 5% sodium hydroxide treated bamboo fibers, (c) 1% ammonium hydroxide treated bamboo fibers and (d) 0.5% potassium permanganate treated bamboo fibers.
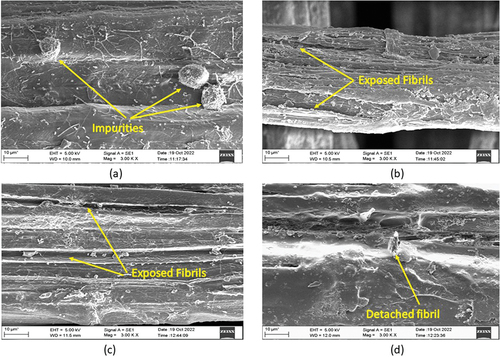
Figure 10. EDS spectrum of (a) untreated bamboo fibers, (b) 5% sodium hydroxide treated, (c) 1% ammonium hydroxide treated and (d) 0.5% potassium permanganate treated bamboo fibers.
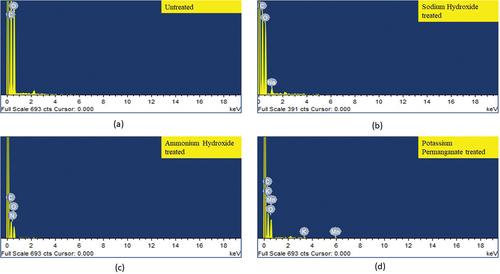
Table 2. Elements present in chemically treated and untreated bamboo fibers.
Data availability statement
The data used to support the findings of this study are included within the article.