
Figures & data
Figure 1. Stitch overlapping (Khalil et al. Citation2023).
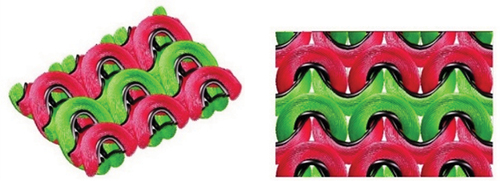
Figure 2. The direction of fibers compared to heat flow direction.
Table 1. Elastic SJKF specifications.
Figure 3. Experimental and predicted values from Schuhmeister, Militky, and ME 2 of thermal conductivity of elastic knitted fabric produced from yarn count 35 Ne.
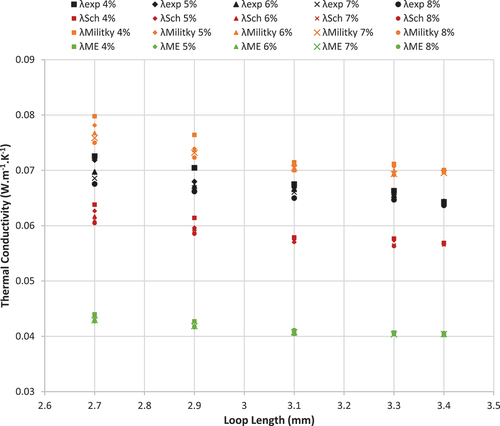
Figure 4. Theoretical image of elastic knitted fabric with the overlapping.
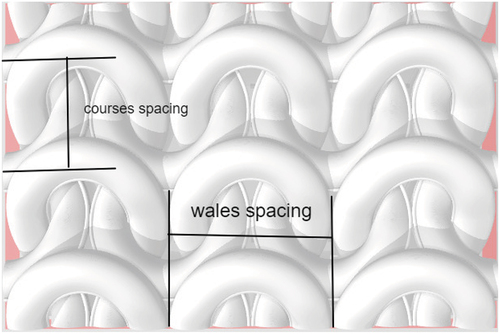
Figure 5. Fibres thermal conductivity components to heat flow direction.
Figure 6. Experimental and predicted values of thermal conductivity of elastic knitted fabric produced from yarn count 35 Ne.
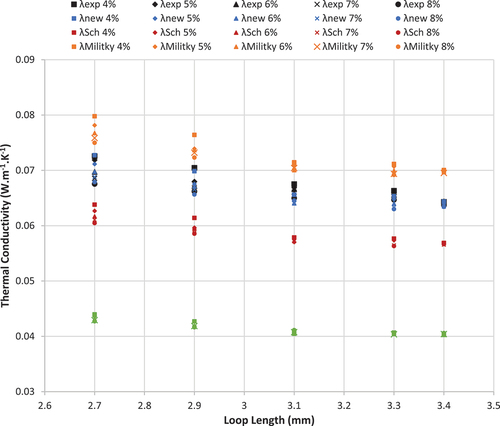
Figure 7. Experimental and predicted values of thermal conductivity of elastic knitted fabric produced from yarn count 25 Ne.
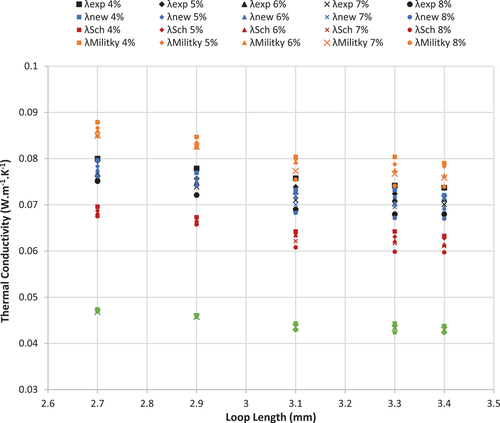
Figure 8. Predicted thermal conductivity values from the new model vs experimental values at different levels of SWP and yarn count.
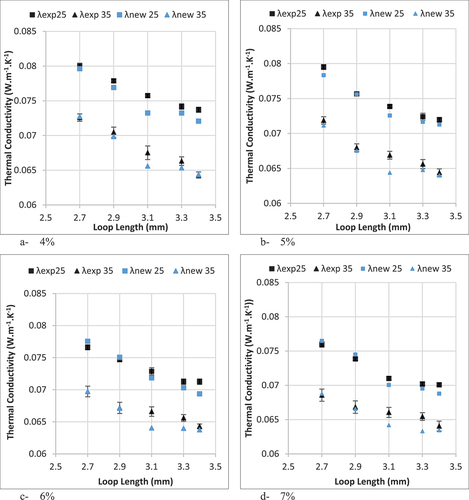
Figure 9. Experimental thermal conductivity vs predicted thermal conductivity from a new model.
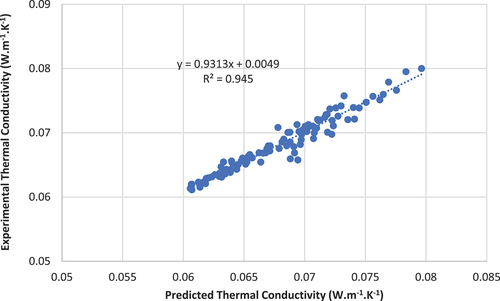
Figure 10. The predicted values of thermal conductivity of elastic SJKF versus loop length.
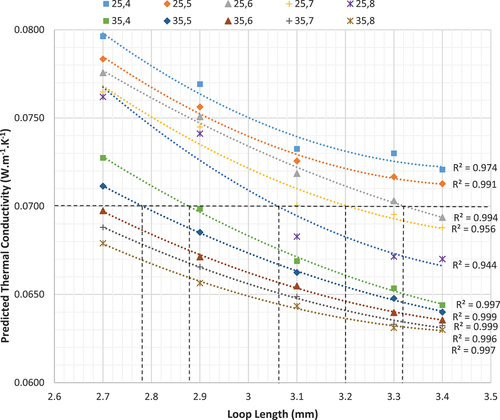
Table 2. Curve fitting equations for the relation between thermal conductivity and loop length.