Figures & data
Figure 1. ATR-FTIR spectra of cot and AmCot) (a) and AmCot-CuO+TiO2) (b).
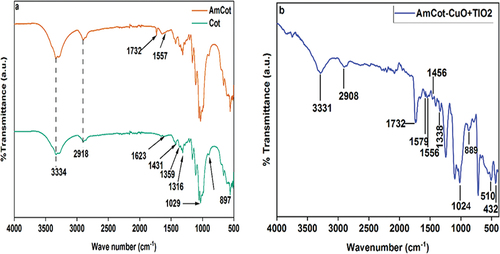
Figure 2. Raman spectra of amcot (a) and AmCot-CuO+TiO2 (b).
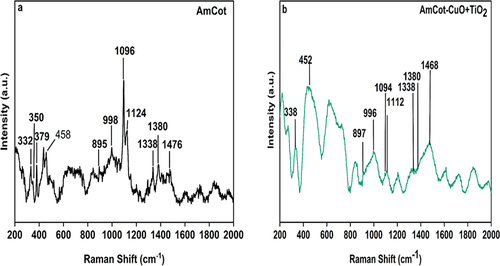
Figure 3. XRD pattern of AmCot-CuO+TiO2.
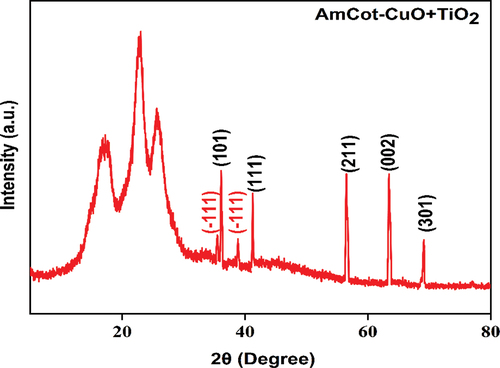
Table 1. Average crystallite size of CuO and TiO2 NPs on Am-Cot-CuO+TiO2 Scherrer equation (Scherrer, Citation1918).
Figure 4. XPS spectra of AmCot-CuO+TiO2, survey (a), Ti 2p (b), Cu 2p (c), C 1s (d), O 1s (e) and S 2P (f).
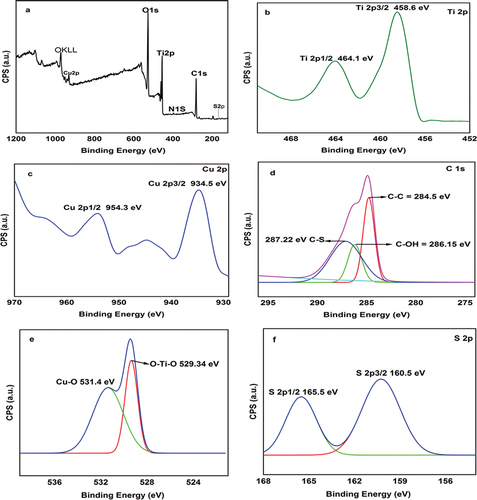
Figure 5. HRSEM micrographs at low-magnification (left,×100) and high-magnification (middle × 1000) and (right × 5000) of (a–d) AmtCot, AmCot-CuO+TiO2 (e–i) and AmCot-CuO+TiO2 after 50 washing cycles (j).
Figure 6. HRSEM micrographs at high magnification (scale bar 50 μm) of (a) AmCot, N and S mapping, (b) AmCot-CuO+TiO2, N and S mapping, and (c) AmCot-CuO+TiO2, Ti and Cu mapping.
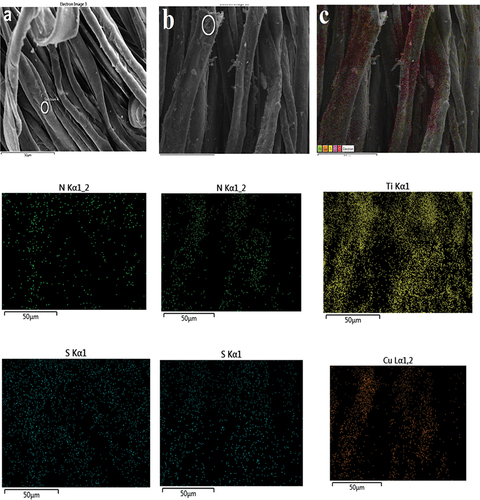
Figure 7. TGA graph of AmCot, AmCot-CuO+TiO2 and AmCot-CuO+TiO2 (50) after 50 washing cycles.
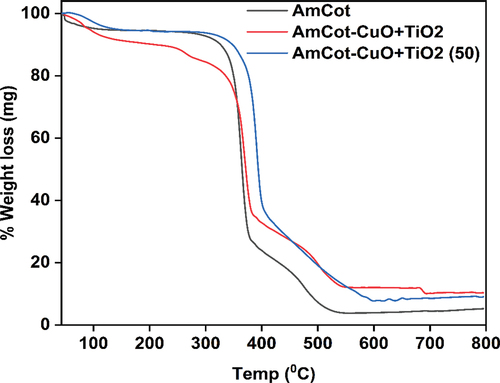
Table 2. Colorimetric data for AmCot and AmCot-CuO+TiO2.
Table 3. Tensile strength and elongation of AmCot and AmCot-CuO+TiO2.
Figure 8. Optical images of the antibacterial activity according to the AATCC 147 test method of (a) AmCot, (b) AmCot-CuO+TiO2 against E. coli, and (c) AmCot, (d) AmCot-CuO+TiO2 against S. aureus.
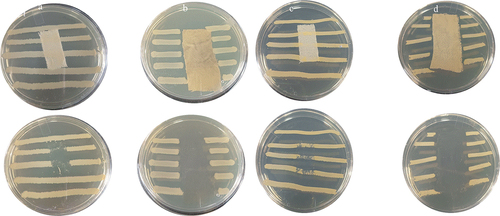
Figure 9. Optical pictures of AmCot-CuO+TiO2 antibacterial washing durability upto 50 laboratory wash cycles.
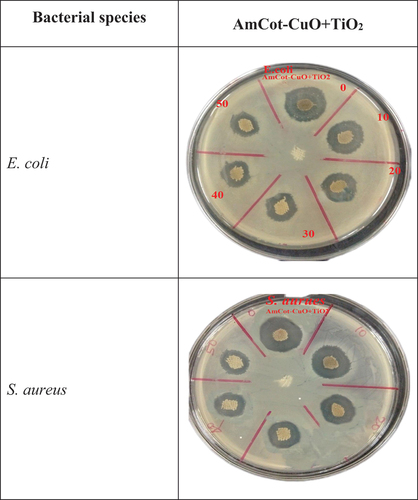
Table 4. AmCot-CuO+TiO2 inhibition zone diameter against E. coli and S. aureus.
Figure 10. UV-DRS spectra of amine modified AmCot, AmCot-CuO+TiO2 and AmCot-CuO+TiO2 (50) after 50 washing cycles.
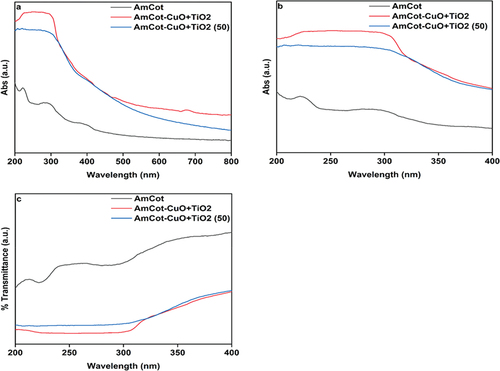
Table 5. UPF values of AmCot, AmCot-CuO+TiO2 and AmCot-CuO+TiO2 (50) after 50 washing cycles.
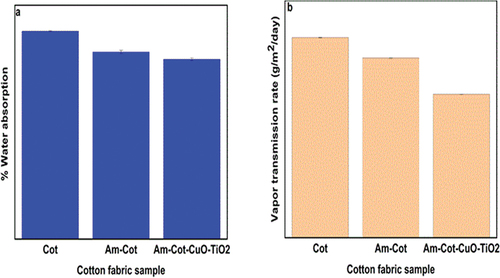
Figure 11. Water absorption percentage (a) and vapor transmission (b) cot, AmCot and AmCot-CuO+TiO2.