
Figures & data
Figure 1. Freeze-dried crude cellulose obtained from R. pseudoacacia pods.
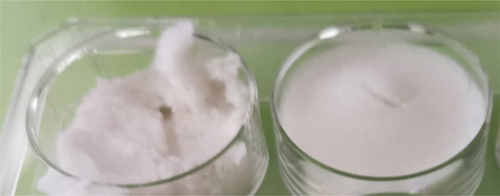
Figure 2. FTIR spectra of cellulose obtained from R. pseudoacacia pods (NC) and cellulose activated by acid hydrolysis with 6 M citric acid (C-NC).
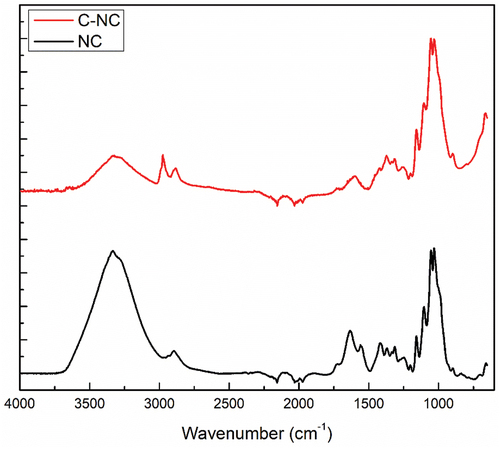
Figure 3. XRD spectrum of cellulose cross-linked with citric acid and dialyzed to pH 6.5.
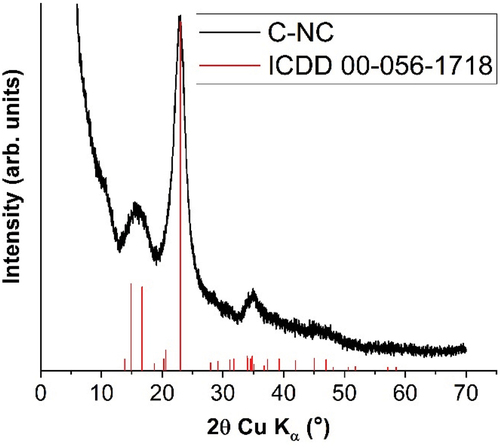
Figure 4. SEM images of the surface of cellulosic material obtained from R. pseudoacacia crosslinked with citric acid (a) 3000 ×, (b) 1000 ×, (c) 500 ×, and SEM images of the native cellulose (d) 1000 ×.
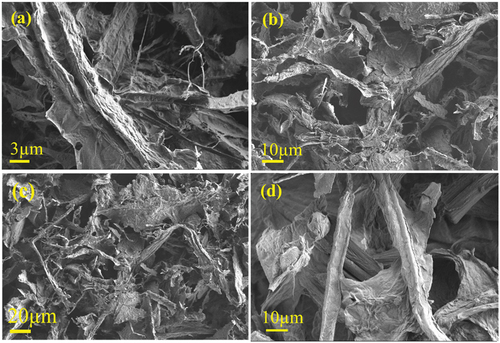
Figure 5. Macroscopic appearance of materials obtained by reinforcing PVA with a citric acid modified-cellulose (isolated from R. pseudoacacia pods), and functionalized with different concentrations of ferulic acid (A − 0.05%, B − 0.5%, C − 0%).
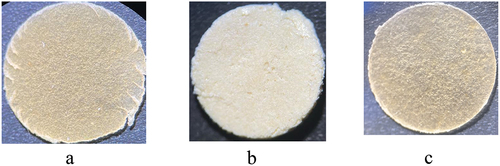
Figure 6. FTIR spectra of PVA-C-NC-FA films obtained from R. pseudoacacia pods (NC) and cellulose crosslinking by hydrolysis with 6 M citric acid (C-NC).
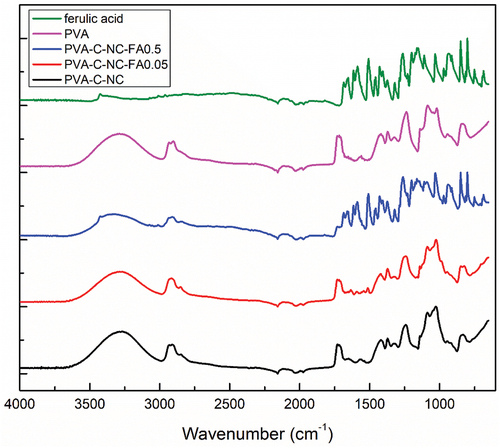
Figure 7. XRD spectra of FA, PVA-crosslinked cellulose with citric acid (PVA-C-NC), with citric acid – FA 0.05% (PVA-C-NC-FA-0.05) and with citric acid – FA 0.5% (PVA-C-NC-FA-0.5).
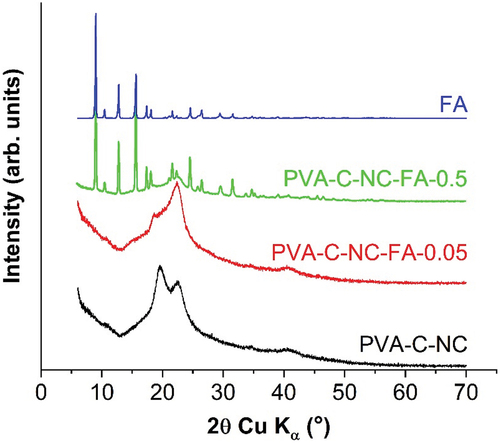
Figure 8. The surfaces wettability behavior of PVA-C-NC composites with different concentrations of FA: a) 0%, b) 0.05% and c) 0.5%.
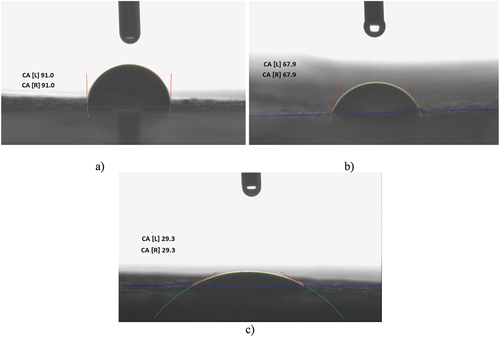
Table 1. The contact angles of samples.
Figure 9. SEM images of the surface of PVA-cellulose films at magnitude of 200× for PVA-C-NC (a), PVA-C-NC-FA-0.05 (b) and PVA-C-NC-FA-0.5 (c).
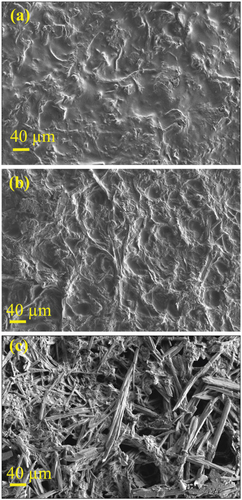
Figure 10. Water solubility (%) – a) and swelling degree (%) – b) of PVA – C- NC films with different concentrations of FA (*p < 0.05, **p < 0.01, ***p < 0.001).
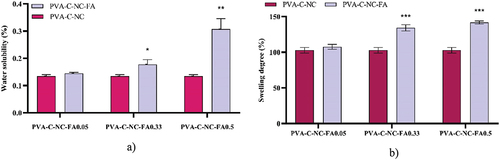
Figure 11. Ferulic acid (FA) release kinetics from the PVA-C-NC-FA matrix as a function of the initially introduced FA concentration, expressed as mg of FA released from one g of material (a) and PVA solubilization kinetics from the PVA-C-NC matrix, expressed as µg PVA released from one g of material (b).
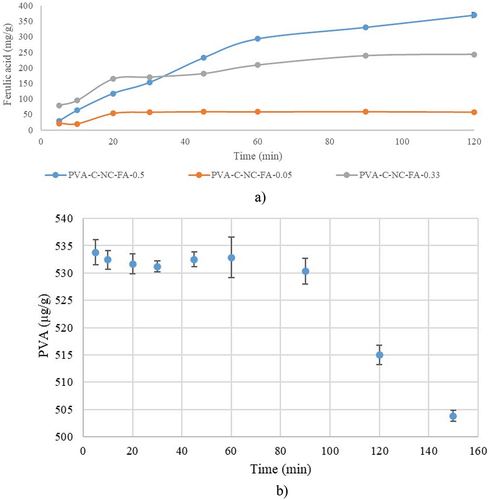
Figure 12. Antioxidant activity of PVA-C-NC with FA of different concentrations, by the CUPRAC method (p < 0.05, samples compared to control without FA).
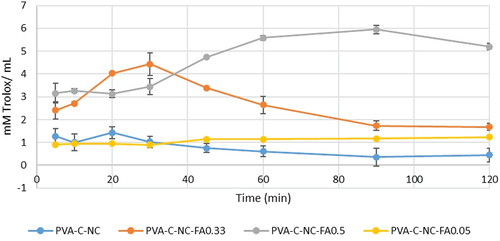
Figure 13. Antioxidant activity of PVA-C-NC with FA of different concentrations, by the DPPH method (p < 0.05, samples compared to control without FA).
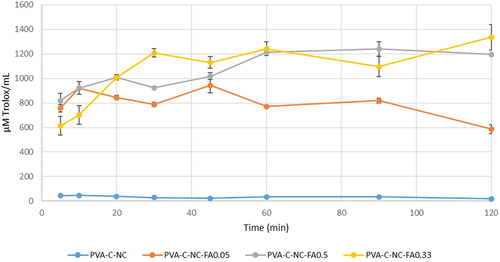
Figure 14. Antioxidant activity of PVA-C-NC with FA of different concentrations, by the FRAP method (p < 0.05, samples compared to control without FA).
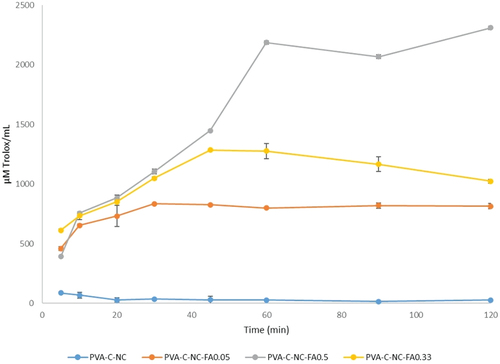
Table 2. Percentage reduction of microbial viability (MV) by the biocomposite films obtained from PVA reinforced with cellulose isolated from R. pseudoacacia pods and functionalized with different concentrations of FA (0.05%, 0.33%, 0.5%). Statistical interpretation was performed in comparison with the material without FA.
Table 3. Inhibition index of biofilm growth (IIBG%) for the biocomposite films obtained from PVA reinforced with cellulose and functionalized with different concentrations of FA (0.5%, 0.33%, 0.05% and 0%). Statistical interpretation was performed in comparison with the material without FA (*p < 0.05, **p < 0.01, ***p < 0.001, ****p < 0.0001).