Figures & data
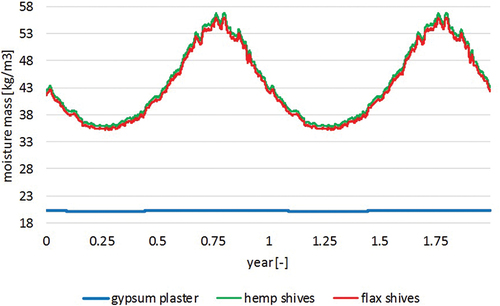
Figure 1. Shives used in own research.
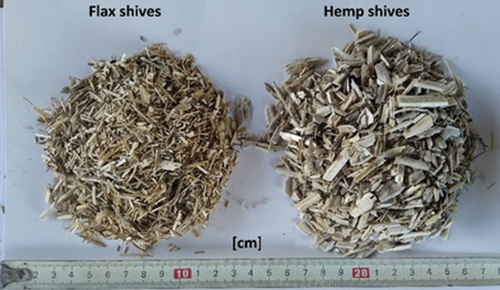
Table 1. Percentage of individual lengths of flax and hemp shives in the mass of the sample.
Table 2. Salt solutions and relative humidity (according to ISO 12,571:2021).
Figure 2. Capillary rise test stand (a), and Arrangement of the shives relative to the water table (b).
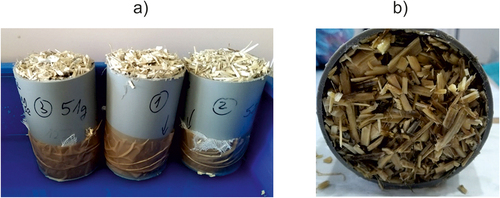
Figure 3. Hygroscopic sorption curves of (a) hemp shiv samples and (b) flax shiv samples.
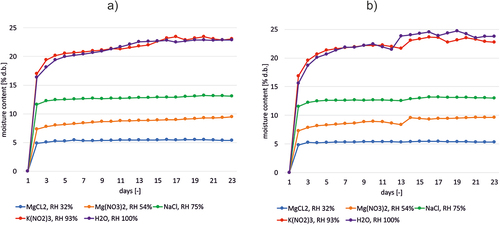
Figure 4. Capillary rise of three specimens of hemp shives (a), and flax shives (b) samples over time.
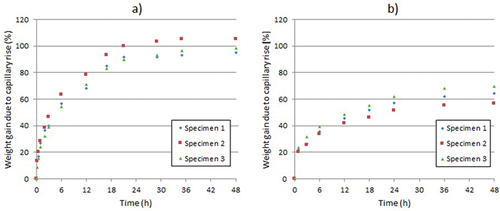
Figure 5. Range of the water raised up in flax shives (a) sample after 48 h of testing, and hemp shives (b) sample after 70 h of testing.
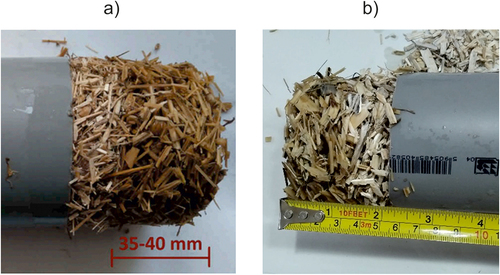
Table 3. Material properties determined during the MIP analysis.
Figure 6. The values of contact angles for the ten specimens of materials: hemp and flax shives.
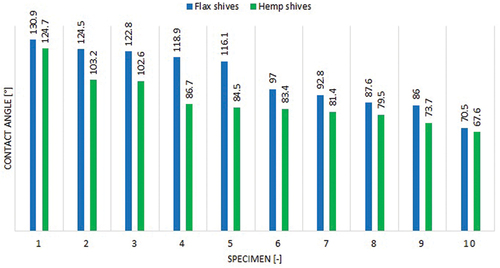
Figure 7. Comparison of average porosity distributions of flax (FS) and hemp shives (HS).
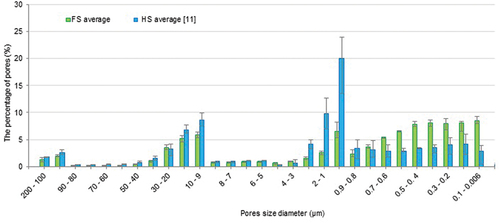
Table 4. Chemical composition of the shives.
Figure 8. Cross-section through flax (a, c) and hemp (b, d) shives, magnification 120× (a, b), 1000× (c, d).
Figure 9. Longitudinal section through flax (a) and hemp (b) shives, magnification 1000 × .
Figure 10. Colonies of filamentous fungi grown on Rose-Bengal Chloramphenicol Agar (RBC) medium from flax shives (a) and hemp shives (b).
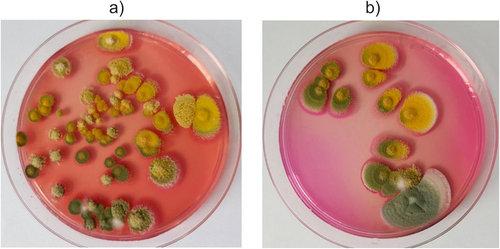
Figure 11. Microscopic views (x100) of Aspergillus flavus conidiophores isolated from flax shives samples.
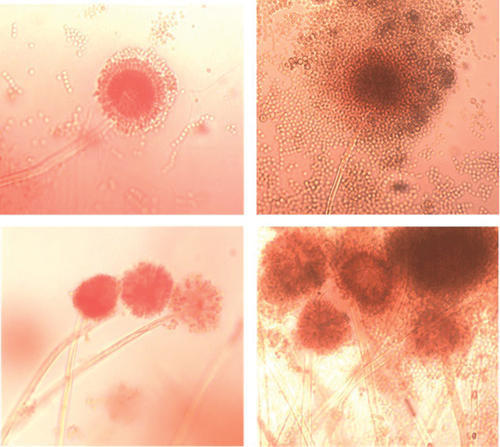
Figure 12. Engyodontium album in hemp shives samples.
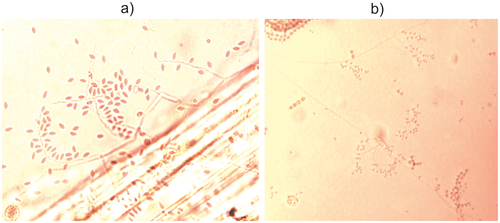
Figure 13. Acremonium in hemp shives samples.
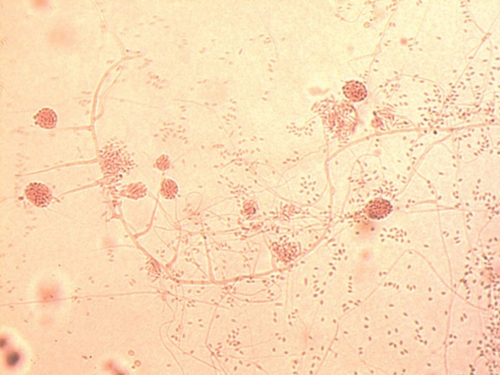
Figure 14. A possible application of loose shives as thermal insulation of the ceiling.
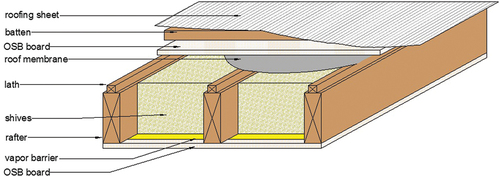
Figure 15. A possible application of loose shives as thermal insulation of the frame wooden wall.
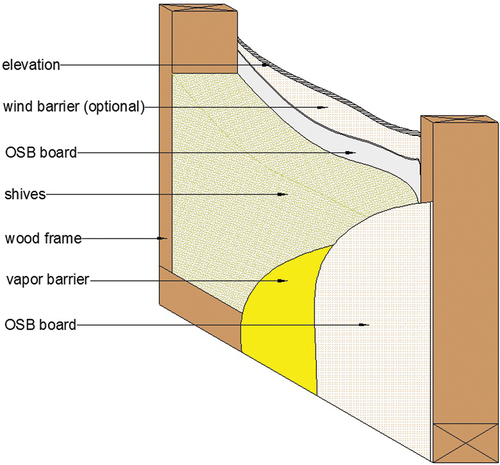
Table 5. Minimal thickness of loose-fill insulation made of HS or FS to achieve required U-value of building element (according to ISO 6946).
Figure 16. Climate conditions and model for simulation: (a) relative humidity and (b) temperature for Olsztyn, based on Typical Meteorological Year (c) internal temperature and relative humidity, (d) cross section of the wall: 1) cement-lime plaster, external (10 mm); 2) mineral wool (150 mm); 3) glue mortar (5 mm); 4) ceramic brick wall (250 mm); 5) glue mortar (5 mm); 6) gypsum plaster/shives layer, internal (3 mm).
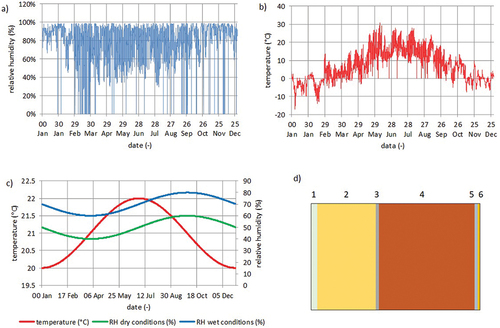
Table 6. Material properties.
Figure 17. Moisture content profiles under dry conditions in the internal finish layer made of gypsum plaster or hemp shives or flax shives.
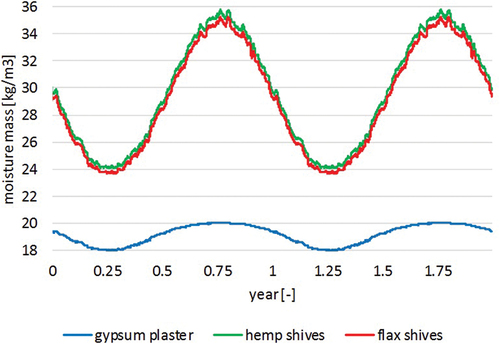
Figure 18. Moisture content profiles under wet conditions in the internal finish layer made of gypsum plaster or hemp shives or flax shives.