
Figures & data
Figure 1. Coat color phenotypes accepted within the Canarian camel breed standard (Fernández de Sierra and Fabelo Marrero Citation2017).
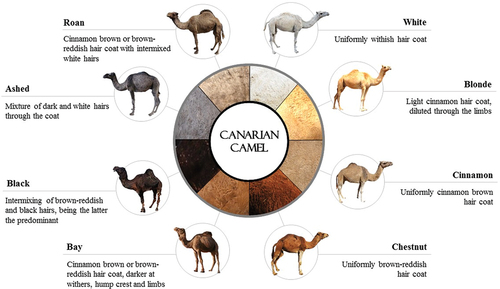
Table 1. Criteria for the classification of dromedary camel and sheep by age group.
Figure 2. Summary of the value of tolerance and VIF after multicollinearity analysis of physical-mechanical of Canarian camel hair and Merino sheep quality-related traits when clustering patterns are phaneroptics (a) and sampling site (b), respectively. Interpretation thumb rule: VIF ≥ 5 (highly correlated); 1 < VIF < 5 (moderately correlated); VIF = 1 (not correlated).
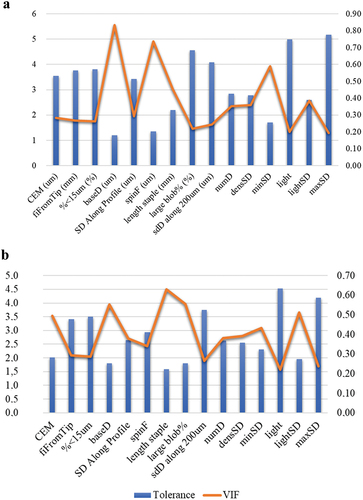
Figure 3. Canonical variable functions and their percentages of self-explained and cumulative variance.
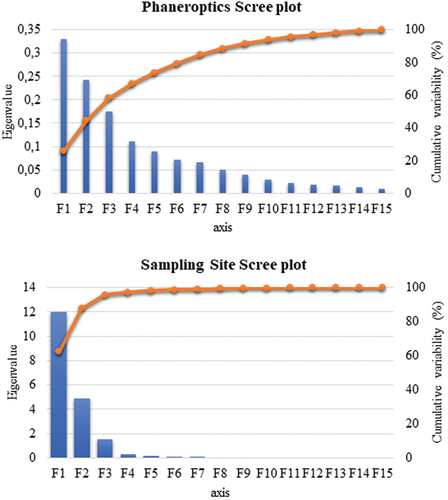
Table 2. Canonical discriminant analysis efficiency parameters to determine the significance of each canonical discriminant function.
Table 3. Results for the tests of equality of group means to test for difference in the means across sample groups once redundant variables have been removed.
Figure 4. Discriminant standardized coefficients for physical-mechanical hair/wool quality related traits in Canarian camel and Merino sheep in each canonical discriminant function. Each bar represents the relative weights (loadings) of each particular trait across the six significant discriminant functions evidenced by the discriminant canonical analysis.
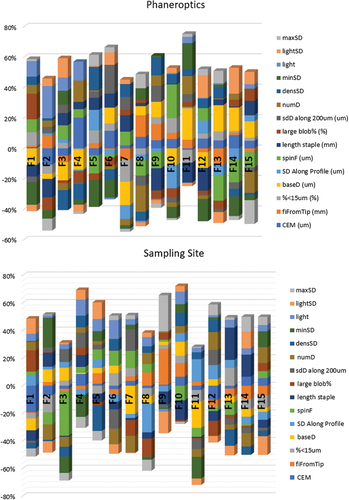
Figure 5. Territorial map depicting the centroids of the different variables (physical-mechanical hair/wool quality related traits) considered in the discriminant canonical analyses.
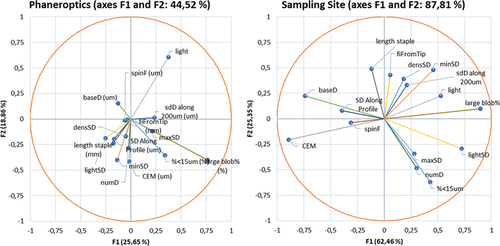
Figure 6. Cladogram constructed from Mahalanobis distances across phaneroptic combinations of coat color and particularities, and eye color in Canarian camels.
Figure 7. Cladogram constructed from Mahalanobis distances across sampling sites and age groups in Canarian camels and Merino sheep.
Supplemental Material
Download Zip (192.5 KB)Data availability statement
The data that support the findings of this study are available from the corresponding author, F.J.N.G., upon reasonable request.