Figures & data
Figure 1. Sonic test set-up: (a) Acoustic sensor model CADPS, (b) IED Automatic impulse device, (c) specimen.
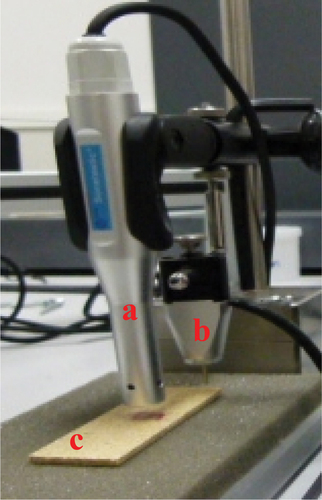
Figure 2. Mass gain (M%) as a function of the square root of time (days 1/2) for the composites with untreated sponge fibers. The nominal fiber volume fraction of the composites is labeled on the curves. (a) Distilled water; (b) Salt water.
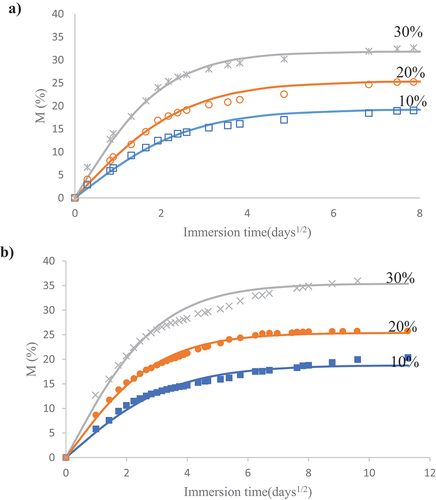
Table 1. Diffusion coefficient and mass saturation value for sponge gourd/epoxy composites immersed in distilled water.
Table 2. Diffusion coefficient and mass saturation value for sponge gourd/epoxy composites immersed in salt water.
Figure 3. Mass gain (M%) as a function of the square root of time (days1/2) for the composites with mercerized sponge fibers. (a) Distilled water; (b) Salt water.
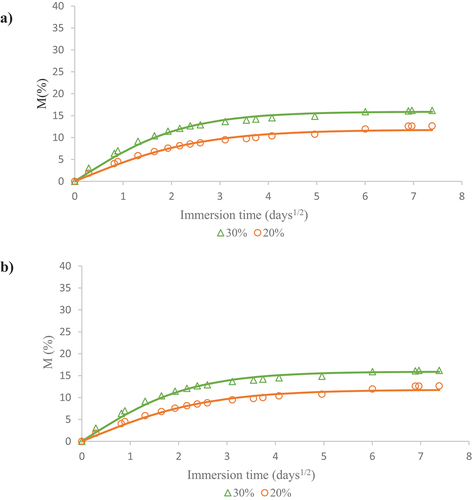
Figure 4. Variation of the Young’s modulus as a function of the immersion time in distilled water. (a) As-received fibers; (b) mercerized; (c) hornified; (d) acetylated.
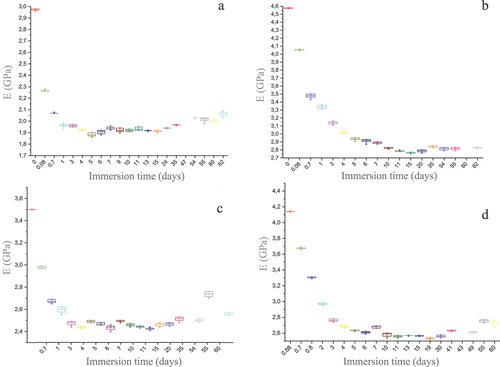
Figure 5. Composite with 20wt% of acetylated fibers immersed in distilled water. (a) variation of the Young’s modulus; (b) mass gain due to water absorption.
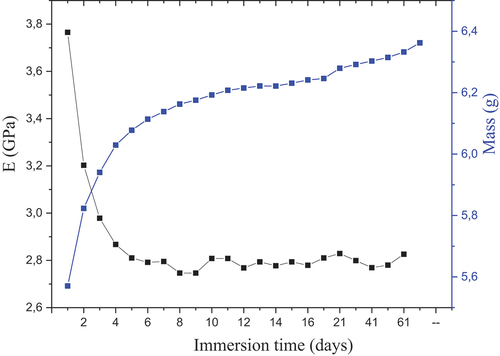
Figure 6. Variation of the elastic modulus before and after immersion in salt water and drying. U stands for untreated, H for hornified, M for mercerized and a for acetylated. The numbers refer to the volume fraction.
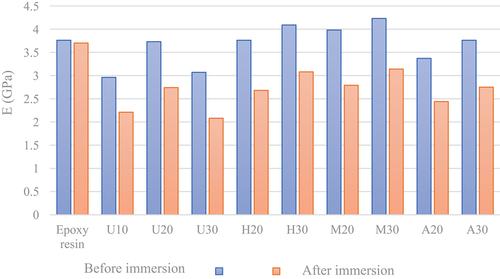
Table 3. Average values of the elastic modulus according to the time of immersion in salt water.
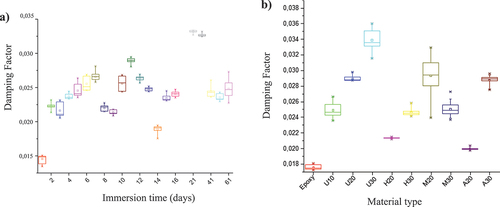
Figure 7. Example of the behavior found for all composites. a) Variation of the damping factor with the immersion time (composites with 20wt% of untreated fibers in distilled water). b) Damping factor values at the end of the saltwater absorption test.